Light in the Labyrinth: Breach Path Analysis for Anyone
Parker Shelton
BSidesSF 2025 — Here Be Dragons · Day 1 · Main
Overview
Security teams are not Theseus navigating the maze — they are Daedalus, having built a complex environment in which they are themselves lost. Breach path analysis, implemented as a security graph, gives defenders the map they need to understand exactly how attackers can traverse their infrastructure. Parker Shelton from Microsoft walks through how to build such a graph from scratch, covering inventory collection, ontology design, graph storage, query languages, and automated computation of attacker TTPs. ---
Key moments
- 3:59 Breach path defined: sequential attacker steps to compromise a network
- 6:00 Azure Functions write access to storage account enables privilege escalation
- 8:00 Intra Partner Tier Two Support role can reset ALL passwords including global admins
- 11:59 Microsoft's internal security graph covers all tenants and breach paths
- 23:59 New open-source security graph tool released live at this BSides talk
- 31:59 Encoding attacker TTPs as combinatorial query fragments to find all paths
- 35:59 Demo: two-TTP breach path where Azure function identity steals Key Vault access
Light in the Labyrinth: Breach Path Analysis for Anyone
Speaker: Parker Shelton
Conference: BSidesSF 2025 — April 26-27, 2025, San Francisco
YouTube: Watch on YouTube
Reading time: ~7 minutes
TL;DR
Security teams are not Theseus navigating the maze — they are Daedalus, having built a complex environment in which they are themselves lost. Breach path analysis, implemented as a security graph, gives defenders the map they need to understand exactly how attackers can traverse their infrastructure. Parker Shelton from Microsoft walks through how to build such a graph from scratch, covering inventory collection, ontology design, graph storage, query languages, and automated computation of attacker TTPs.
Introduction
Every defender has felt the disorientation of not knowing how an attacker might move through their environment. The assets exist, the permissions are configured, the access controls are set — but can anyone trace the exact sequence of steps a threat actor would take from an internet-exposed service to the crown jewels? For most organizations, the honest answer is no.
Parker Shelton opened his BSidesSF 2025 talk with a retelling of the myth of Theseus and the Minotaur. From Theseus's perspective, it is a hero story. But from King Minos's vantage point, an unknown actor entered his environment, disabled his defenses, and walked off with his most prized possession. Shelton's key reframe: security professionals are not really Theseus — they are Daedalus, the architect who built the labyrinth and is now lost inside it. The solution, he argued, is not more thread but a map. Specifically, a security graph.
The Problem: Breach Paths in the Wild
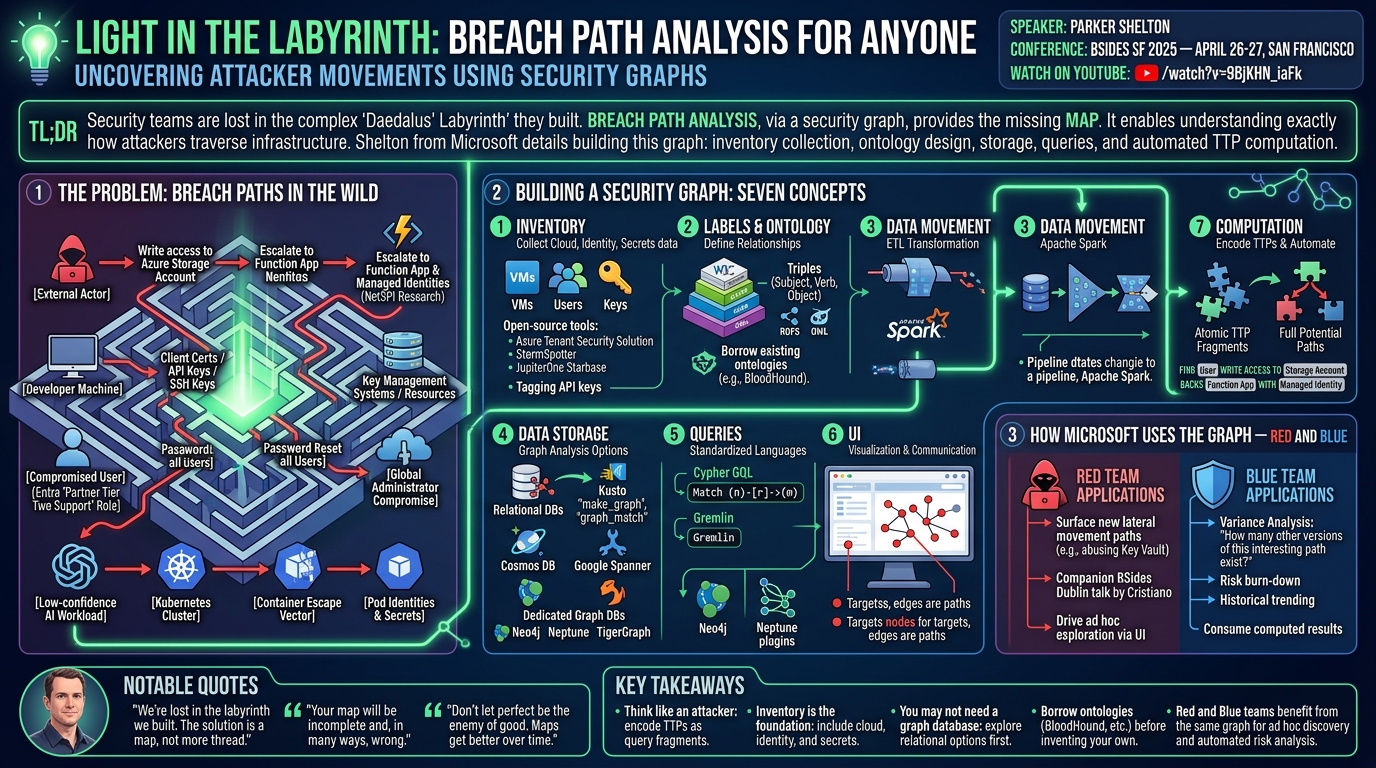
▶ Watch: Breach path examples (04:00)
Shelton illustrated the concept of a breach path — a sequence of steps a threat actor takes to infiltrate, move laterally, or escalate privileges — with several concrete examples drawn from real-world research.
One involves Azure Function Apps and their backing storage accounts. NetSPI research presented at DEF CON 31 demonstrated that write access to a storage account used by a Function App could enable privilege escalation to the app service and any managed identities associated with it. Before 2023, Microsoft's own documentation did not warn about this risk. An attacker who could not directly reach a Function App could instead traverse through the storage account — a lateral movement path invisible without a map.
Another example: X.509 client certificates stored on developer machines. A certificate that authenticates to an application can chain to key management systems, which themselves hold secrets and credentials for further resources. Similarly, API keys committed to Git repositories and SSH keys on developer laptops represent persistent edges in the graph that attackers actively exploit.
The Entra directory role landscape offers a third example. The Partner Tier Two Support role — described in the talk "The Most Dangerous Entra Role You've Probably Never Heard Of" — can reset passwords for all users in a tenant, including global administrators. Shelton walked through how compromising any user holding that role, or managing to assign oneself those permissions, provides a path to tenant-wide compromise through a single step.
▶ Watch: Kubernetes and container escape paths (08:00)
Kubernetes adds further complexity. Containers are not a security boundary at the level of hypervisors, meaning that low-confidence workloads — including externally-run AI models, which Wiz has argued should be treated as code — running in the same cluster as critical services represent a potential container escape vector. Pod identities used to fetch secrets from downstream services become credentials an attacker can steal post-escape.
Building a Security Graph: Seven Concepts
▶ Watch: Architecture overview (12:01)
Shelton dedicated the second half of his talk to the engineering of a security graph — a structured, queryable representation of all assets and the relationships between them. He organized the design space into seven concepts:
1. Inventory — The graph must include cloud assets (VMs, load balancers, storage, databases), identity (Entra/Okta users, directory roles, groups, service principals, workload identities), and secrets (Key Vault, HashiCorp Vault, SSH keys, TLS/mTLS certificates, API keys). Microsoft has open-sourced the Azure Tenant Security Solution and StormSpotter for cloud inventory collection; JupiterOne's Starbase project is a similar open-source option. A key challenge is understanding what each secret or credential gives access to — the target of an edge — which requires developer-facing programs for tagging API keys with their intended scope.
2. Labels and Ontology — Modeling assets with the right vocabulary is non-trivial. Shelton introduced the W3C Semantic Web Layer Cake as a conceptual guide: data is represented as triples (subject, verb, object), with RDFS providing schemas and the Web Ontology Language (OWL) adding semantics such as transitivity. Practitioners can borrow ontologies from existing tools — Shelton highlighted BloodHound's as a reference — and adapt them. Microsoft released a new open-source project at the time of this talk containing a sample toy graph and ontology that attendees could explore.
3. Data Movement — Existing security telemetry arrives from relational sources. An ETL process transforms it into graph-friendly triple representation. Apache Spark is a popular choice, though any pipeline capable of reshaping relational data into nodes and edges will work.
4. Data Storage — Shelton challenged the assumption that a graph database is required. Relational databases with join operations can approximate graph traversals. Kusto (Azure Data Explorer) has added make_graph and graph_match operators that allow property graph queries over relational data. Cosmos DB and Google Spanner offer native graph analytic capabilities. For teams with specialized needs, dedicated graph databases such as Neo4j, Neptune, or TigerGraph are options.
5. Queries — The ISO-standardized Graph Query Language (GQL), which reached completion in 2024 and descends from Neo4j's OpenCypher, provides a visual, declarative syntax using nodes in parentheses and arrows for edges. Apache TinkerPop's Gremlin is a functional alternative popular in certain ecosystems. The choice largely comes down to which databases and vendor ecosystems the team already operates.
▶ Watch: Graph computation and TTP encoding (32:02)
6. UI — Visualizing the graph is critical, especially for executive communication. A picture of a node that needs to be protected or an edge that needs to be cut communicates security problems far faster than text reports. Neo4j ships a built-in UI; Neptune supports visualization plugins; for custom stacks, any tool that can query the graph can serve as a frontend.
7. Computation — The core of breach path analysis: encoding attacker tactics, techniques, and procedures (TTPs) as query fragments. Each fragment represents an atomic action — "given access to this resource, the attacker would do this next." Combining fragments combinatorially covers the multiverse of possible attacker paths without requiring prediction of which branch will actually be taken. Shelton demonstrated a Cypher query that finds any user with write access to a storage account where that account backs a Function App with a managed identity — identifying all privilege escalation risks from that particular TTP in one pass.
How Microsoft Uses the Graph — Red and Blue
▶ Watch: Red team and blue team applications (36:02)
The security graph Shelton's team built is used simultaneously by red and blue teams at Microsoft. On the red side, it helps surface new paths into sensitive systems — a companion talk at BSides Dublin by Cristiano on the Microsoft Red Team covered abusing Key Vault for lateral movement, with many of those paths discovered via the graph. On the blue side, teams use variance analysis to ask: "We saw a threat actor do something interesting here — how many other versions of that path exist in the graph?" Both functions share the same underlying data structure, with red teams driving ad hoc exploration through the UI and blue teams consuming computed results for risk burn-down and historical trending.
Notable Quotes
"We'd like to think we're the hero of this story — Theseus winning the day. But from King Minos's perspective, an unknown actor entered his environment, disabled his defenses, and ran away with his most prized possession." — ▶ 00:00
"Your map will be incomplete. In many ways, it will be wrong. Ask me over drinks what adversaries have taught me about how our systems actually work." — ▶ 20:02
"Don't let perfect be the enemy of good. Maps get better over time as one explores more." — ▶ 22:02
Key Takeaways
- Breach path analysis requires thinking like an attacker. A security graph does not just catalog assets — it encodes attacker TTPs as query fragments and combines them to surface every possible lateral movement path.
- Inventory is the foundation. Missing inventory means missing breach paths. Cloud assets, identity (including guest users and workload identities), and secrets all need to be represented as nodes with accurate edges between them.
- You may not need a dedicated graph database. Relational databases with graph operators, Kusto's
make_graph/graph_match, and federated query solutions can all approximate graph traversal — the right choice depends on existing data infrastructure. - Borrow ontologies before inventing your own. BloodHound's ontology and Microsoft's new open-source sample graph are useful starting points; understanding how existing tools model relationships reveals both design patterns and edge cases.
- Red and blue teams benefit from the same graph. Attack path discovery and defensive risk analysis are complementary queries over the same data — building a single graph that both teams use reduces duplication and accelerates both functions.
Reviews
Dr. Zero (Offensive Security Researcher) — STRONG ACCEPT
Shelton delivers a structural approach to attack path analysis that scales beyond what BloodHound-style point solutions cover — the seven-concept graph architecture with encoded TTP fragments is the right mental model for enterprise-scale breach path work. The Daedalus reframe is well-landed and the Microsoft production usage with red and blue teams sharing the same graph is genuinely interesting. This is one of the stronger defensive engineering talks of the batch.
Heather Calloway (CISO) — STRONG ACCEPT
Shelton's security graph is the operational artifact that closes the gap between 'we have access controls' and 'we know how an attacker would traverse them.' The Azure Function App storage account privilege escalation path — undocumented in Microsoft's own docs until 2023 — is the kind of breach path that organizations are currently unaware they have. The framework is ambitious but the engineering guidance is grounded.