Trace to Triage: How to Connect Product Vulnerabilities to Security Paths
Ben Stav
BSidesSF 2025 — Here Be Dragons · Day 1 · Main
Overview
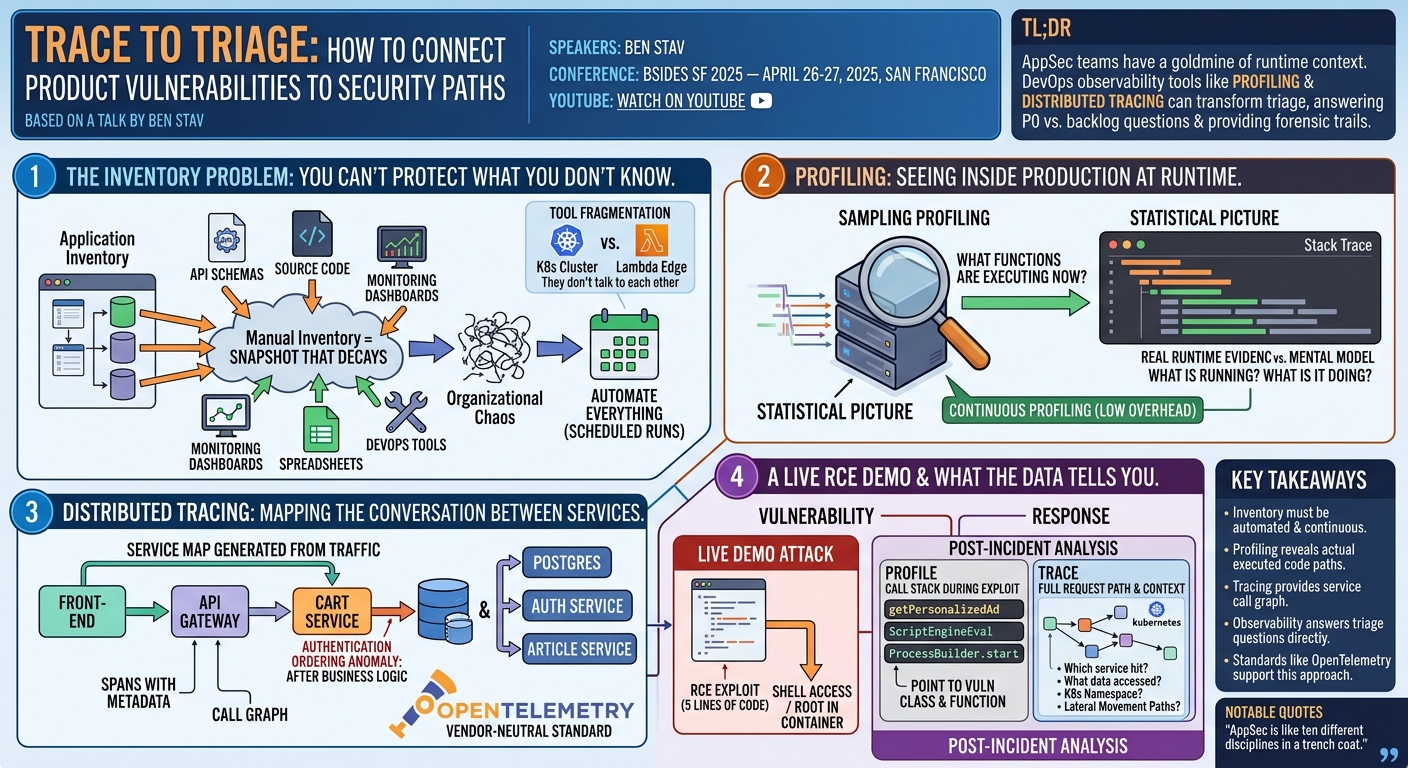
Application security teams sit on a goldmine of runtime context that could transform how they triage findings — and most of them don't know it exists. Ben Stav from MIGO makes the case that observability tools built for DevOps, specifically profiling and distributed tracing, can answer the critical questions that define whether a finding is a P0 or a backlog item, while also providing the forensic trail needed after an incident. ---
Key moments
- 0:00 ADR platform intro: observability for security, not just monitoring uptime
- 2:02 AppSec framing: 'ten disciplines in a trench coat' — full SDLC scope
- 4:00 Day-zero strategy: inventory first before protecting anything else
- 6:00 API inventory methods: schema dumps, source code, tooling, monitoring dashboards
- 8:00 Key insight: monitoring data is overlooked inventory source organizations already have
- 10:02 Tool fragmentation problem: EC2 listing irrelevant for Kubernetes-native organizations
- 12:00 Demo: RCA using observability trace to connect vulnerability to security impact path
Trace to Triage: How to Connect Product Vulnerabilities to Security Paths
Speakers: Ben Stav
Conference: BSidesSF 2025 — April 26-27, 2025, San Francisco
YouTube: Watch on YouTube
Reading time: ~8 minutes
TL;DR
Application security teams sit on a goldmine of runtime context that could transform how they triage findings — and most of them don't know it exists. Ben Stav from MIGO makes the case that observability tools built for DevOps, specifically profiling and distributed tracing, can answer the critical questions that define whether a finding is a P0 or a backlog item, while also providing the forensic trail needed after an incident.
Introduction
Ben Stav opened his BSidesSF 2025 talk with a collective breath. Not a gimmick: his point was that AppSec is genuinely hard — "ten disciplines in a trench coat" — and that security practitioners are expected to navigate engineers, operations, DevOps, finance, compliance, and constant P0 escalations all at once. The collective breath was an invitation to slow down before sprinting.
Stav heads architecture at MIGO, an application detection and response (ADR) platform focused on production observability for security. His talk drew on that background to argue that AppSec practitioners have been overlooking a rich source of context that DevOps and engineering teams have quietly been building for years: profiling and distributed tracing, the two foundational techniques of modern observability.
The Inventory Problem: You Can't Protect What You Don't Know
▶ Watch: Application inventorying and the baseline problem (06:00)
The first third of the talk framed the foundational challenge: before you can respond to a vulnerability, you need to understand what you have. Application security starts with inventorying — and inventorying is harder than it sounds.
An "application" is not a uniform concept. For a B2B SaaS company it means a collection of services with defined external interfaces. For a company shipping vending machines it means something entirely different. Getting a working inventory requires pulling from multiple sources simultaneously: API schema dumps, source code searches, existing tooling, monitoring dashboards (which Stav called "often overlooked" — if the business cares about uptime, there are probably dashboards that reveal the service structure), and occasionally a well-organized spreadsheet maintained by one unusually thorough engineering manager.
Even after assembling all of those sources, the picture is incomplete. Organizations that have grown past the "two people in a garage" stage accumulate organizational chaos: gaps in documentation, developers who don't know exactly what's running in production, DevOps teams who don't know the security intent of what they're deploying. The job of AppSec is to reduce this chaos, not add to it.
The practical answer is automation — everything collected manually must be automated and run on a schedule. Source code scans for endpoint definitions should be automated. OpenAPI schema validation should be automated. Anything done manually once must eventually run without human intervention.
Stav also highlighted an important reality: tool fragmentation makes this genuinely difficult. A company running autoscaled Kubernetes clusters does not care about listing EC2 instances and subnets — that's noise. A company running Lambda Edge finds both of those concepts irrelevant. And the tools rarely talk to each other: a source code scanner that identifies API endpoints and a runtime scanner that probes endpoints from the outside operate in completely different namespaces, leaving the correlation entirely to the human practitioner.
Profiling: Seeing Inside Production at Runtime
▶ Watch: Sampling profiling for security use cases (20:00)
The core insight of Stav's talk is that two observability techniques — sampling profiling and distributed tracing — were designed to answer performance questions but can be repurposed to answer security questions.
Sampling profiling is relatively straightforward: at regular intervals, the profiler asks a running application "what functions are you executing right now?" and records the call stack. Over time, this produces a statistical picture of which code paths are actually executing in production. The original purpose is performance analysis — identifying slow queries, finding quadratic-complexity functions that are eating CPU. But through a security lens, profiling answers a different question: what is actually running in production, and what is it doing?
This is valuable because the mental model any security practitioner builds by reading source code is necessarily incomplete. Code has multiple execution paths; not all of them are apparent from reading. Profiling provides actual runtime evidence of which paths execute for which requests. For AppSec practitioners, that means understanding what's really happening rather than what should be happening according to the code — a distinction that matters enormously when evaluating a finding.
The concept of continuous profiling — running profiling in production with low enough overhead that it can run all the time — has gained significant traction over the past several years. This means the profiling data may already exist in an organization's observability stack, waiting to be used for security analysis.
Distributed Tracing: Mapping the Conversation Between Services
▶ Watch: Tracing and the service map no one has (26:00)
Where profiling provides depth (what is happening inside one service), distributed tracing provides breadth: which service called which other service, over what protocol, with what data, and in what sequence.
A trace is a structured record of a request as it propagates through a distributed system. A user hits the front-end service; the front-end makes a gRPC call to a cart service; the cart service queries Postgres and then calls an authentication service; the authentication service calls an article service. Each of these interactions is captured as a span with timing data, identifiers, and associated metadata.
Stav showed a real trace from the OpenTelemetry demo project — a multi-service shop application he had instrumented with injected vulnerabilities for a live demonstration. Looking at the trace visualization, he noted an immediate security observation: the call to authenticate happened after calling the cart service. In a correctly designed system, authentication should precede any business logic. That ordering anomaly is exactly the kind of finding a threat model review should produce — and here it appeared for free, directly from the observability data.
The practical impact of tracing on AppSec work is that it provides what Stav described as a "service map that the entire security team has been asking for." Most organizations have some notion of which services exist, but the actual call graph — who is talking to whom, about what, over which protocol — is typically "behind some bearded guy on a whiteboard." Tracing generates that map from actual production traffic, not from documentation that may be months out of date.
The dominant standard for creating, exporting, and visualizing this data is OpenTelemetry, a CNCF project with widespread vendor support. Because it is vendor-neutral, organizations can collect traces and profiles with one tool and send them to any of multiple compatible backends.
A Live RCE Demo — and What the Data Tells You
▶ Watch: Live RCE demo and post-incident analysis using observability (32:00)
To make the argument concrete, Stav ran a live demonstration. He took the OpenTelemetry demo shop application, injected a vulnerability, and executed a remote code execution attack against it in front of the audience. The exploit — five lines of code, elaborated by an LLM into a more dramatic form — established shell access running as root in a container.
The point of the demo was not the attack. It was what happened immediately after. Using the trace and profile data collected during the attack:
- The profile showed the call stack at the moment of exploitation:
getPersonalizedAd→ScriptEngineEval→ProcessBuilder.start. For anyone familiar with Java, that sequence is instantly interpretable — a template engine evaluated user-supplied content and executed a process. This is a direct pointer to the class of vulnerability (server-side template injection) and the exact function responsible.
- The trace showed the full request path: front-end → API gateway →
getPersonalizedAdservice, with Postgres queries and HTTP requests to other services. Combined with accumulated inventory context about the Kubernetes cluster and namespace, the trace immediately answers questions that would otherwise require manual log archaeology: which service was hit, what data it accessed, what Kubernetes namespace it lives in, and what else is running alongside it.
These are precisely the questions that drive triage priority. Is this service internet-facing? Does it process PHI? What lateral movement paths exist from its network position? With profiling and tracing data attached to a finding, the answers are available in minutes rather than hours.
Stav emphasized that this data is useful not just for immediate triage but for post-incident retrospectives. Stack traces and traces are formats that DevOps and engineering teams understand natively. Handing them to an engineering team during a postmortem is far more productive than asking them to parse unfamiliar security-tool output.
Notable Quotes
"AppSec is like ten different disciplines in a trench coat." — Ben Stav (03:00)
"This has been going on for years behind our backs and nobody told us." — Ben Stav, on profiling and tracing data being available to security teams (28:00)
"Context is king. Just the answer for which service this is in already gives you either chills down your spine or 'okay, whatever'." — Ben Stav (30:00)
Key Takeaways
- Inventory is the foundation of AppSec. Understanding what your applications are composed of — services, data flows, SDLC artifacts — must be automated and continuously refreshed; manual inventory is a snapshot that decays immediately.
- Sampling profiling reveals what code is actually executing in production. Where source code review builds a mental model of what should happen, profiling provides empirical evidence of what does happen — including unexpected code paths that static analysis cannot find.
- Distributed tracing provides the service call graph your threat model needs. OpenTelemetry traces capture which service calls which, over what protocol, with what data — the kind of map that typically lives on a whiteboard rather than in any tool.
- Observability data can answer triage priority questions directly. Is this service internet-facing? What does it access? What namespace is it in? What lateral movement is possible from here? These questions can be answered from trace and profile data without manual log archaeology.
- Standards and vendor ecosystems now support this approach. OpenTelemetry is a mature, vendor-neutral CNCF standard with wide instrumentation support; security teams can adopt it without being tied to a single vendor's tool chain.
Reviews
Dr. Zero (Offensive Security Researcher) — STRONG ACCEPT
Stav identified a real, underexploited data source for AppSec triage — OpenTelemetry profiling and distributed tracing — and demonstrated it with a live RCE. The call stack showing getPersonalizedAd → ScriptEngineEval → ProcessBuilder.start as real-time forensic evidence of server-side template injection is exactly the kind of concrete artifact that wins over a skeptical engineering team.
Heather Calloway (CISO) — SOLID
Stav makes a legitimate case that DevOps observability data — profiling and distributed tracing — can answer security triage questions that AppSec teams currently spend hours trying to answer manually. The RCE demo is effective. The audience is AppSec practitioners, and it serves them well.