BIN2TL: Visualizing Program Dynamics with Perfetto
Michael Telloyan (Undergraduate Student · Mandian)
CODE BLUE 2025 · Day 1 · Bluebox
Overview
In the realm of binary analysis, understanding the dynamic behavior of executables is paramount, yet often fraught with challenges. Michael Telloyan's talk at CODE BLUE introduces BIN2TL, an innovative approach that transforms static binary analysis into an interactive, visual experience. BIN2TL captures the entire execution flow of a binary and converts it into a rich, interactive profile, leveraging the powerful Perfetto (or Chromium trace) visualization framework. This talk addresses the limitations of traditional static and dynamic analysis tools, proposing a workflow that significantly minimizes analysis time and enhances comprehension of complex program dynamics. Michael Telloyan, an undergraduate student at Mandian with a strong background in both engineering and reverse engineering, including participation in DEF CON CTFs, demonstrates how this tool can revolutionize everyday binary analysis by providing a high-level, chronological overview of execution, arguments, return values, and threading behavior.
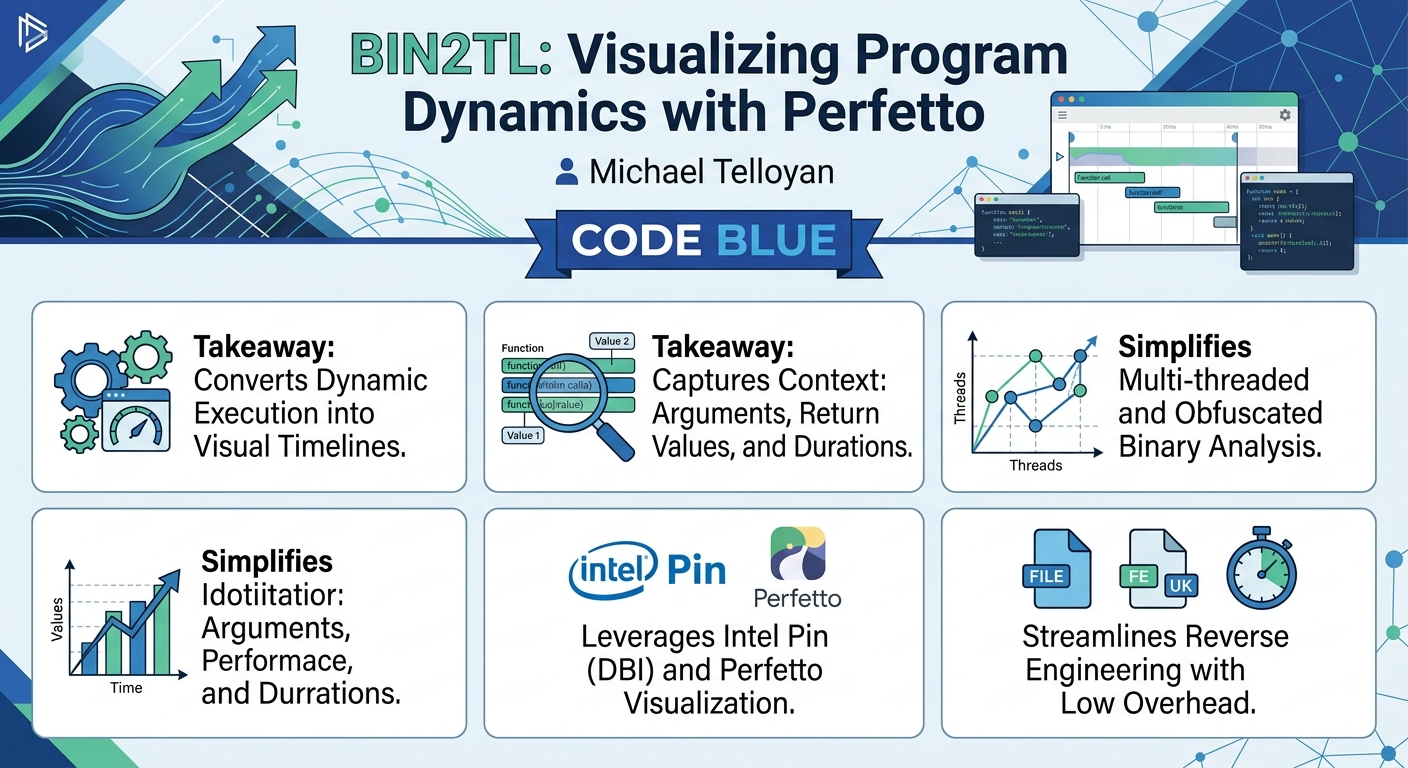
Key moments
- 0:00 Introduction to BIN2TL and current challenges
- 6:50 BIN2TL output: visualizing function calls and arguments
- 11:00 Technical details: Intel Pin for binary instrumentation
- 16:40 Live demo: Tracing a binary and visualizing with Perfetto
- 22:00 Comparing BIN2TL against other binary analysis tools
- 26:50 Summary: BIN2TL's advantages and impact on analysis
BIN2TL: Visualizing Program Dynamics with Perfetto
Speakers: Michael Telloyan, Undergraduate Student, Mandian
Conference: CODE BLUE
YouTube: https://www.youtube.com/watch?v=bQWHAOlo_mE
Overview
In the realm of binary analysis, understanding the dynamic behavior of executables is paramount, yet often fraught with challenges. Michael Telloyan's talk at CODE BLUE introduces BIN2TL, an innovative approach that transforms static binary analysis into an interactive, visual experience. BIN2TL captures the entire execution flow of a binary and converts it into a rich, interactive profile, leveraging the powerful Perfetto (or Chromium trace) visualization framework. This talk addresses the limitations of traditional static and dynamic analysis tools, proposing a workflow that significantly minimizes analysis time and enhances comprehension of complex program dynamics. Michael Telloyan, an undergraduate student at Mandian with a strong background in both engineering and reverse engineering, including participation in DEF CON CTFs, demonstrates how this tool can revolutionize everyday binary analysis by providing a high-level, chronological overview of execution, arguments, return values, and threading behavior.
The core motivation behind BIN2TL is to streamline the arduous process of reverse engineering and vulnerability research. Analysts often spend considerable time switching between static disassemblers like IDA Pro or Ghidra and dynamic debuggers like GDB, repeatedly setting breakpoints and observing execution. This fragmented workflow is particularly inefficient for multi-threaded applications or obfuscated binaries. BIN2TL offers a cohesive solution by generating a comprehensive timeline of program execution, allowing analysts to quickly grasp the "what, when, and how" of a binary's operations, thereby transforming a time-consuming, iterative process into a more intuitive and efficient exploration.
Background
▶ Watch: Introduction to BIN2TL and current challenges (0:00)
Binary analysis is typically categorized into static and dynamic methods, each with inherent limitations. Static analysis involves examining the binary's code without executing it. Tools like file, strings, and binwalk provide surface-level information, while disassemblers and decompilers such as IDA Pro and Ghidra attempt to reconstruct the program's logic at the instruction, intermediate language, or pseudocode level. However, static analysis often struggles with accuracy, readability, and is notoriously ineffective against obfuscation techniques, which intentionally obscure the true program logic.
Dynamic analysis, on the other hand, involves executing the binary and observing its behavior at runtime using debuggers like GDB. While debuggers offer granular control—allowing analysts to inspect register values, memory, and set breakpoints—they are typically program-specific and require constant manual interaction. This approach is cumbersome for understanding the overall flow of an application, especially multi-threaded ones, and can be platform-specific (e.g., GDB on Linux vs. WinDbg on Windows). The common questions that arise during dynamic analysis—such as the timing of function calls, the sequence of execution, the actual arguments passed, return values, and the duration of specific functions—are difficult to answer efficiently with traditional debuggers, which often provide a linear, event-driven view rather than a holistic timeline. The overhead introduced by heavy debugging can also distort the actual timing and behavior of the program, further complicating analysis. BIN2TL emerges as a solution to bridge this gap, offering a dynamic view without the heavy interactive burden of traditional debuggers, aiming for minimal overhead and a comprehensive, visual timeline.
Key Findings
▶ Watch: Technical details: Intel Pin for binary instrumentation (11:00)
BIN2TL introduces a paradigm shift in binary analysis by converting dynamic program execution into an interactive, chronological timeline. The primary insight is that a visual representation of execution, similar to performance profilers, can significantly accelerate understanding compared to textual logs or step-by-step debugging. The tool's core contribution is its ability to capture a wide array of dynamic context—including function calls, their arguments, return values, execution durations, and threading information—and present it in a highly intuitive format.
A key finding is the successful integration of powerful, existing open-source technologies to create a novel analysis workflow. BIN2TL leverages Intel Pin, a robust Dynamic Binary Instrumentation (DBI) framework, for precise and customizable data capture at runtime. This allows for granular instrumentation, from instruction-level callbacks to basic block and memory access monitoring. For visualization, BIN2TL capitalizes on Perfetto (or the Chromium trace format), a sophisticated trace visualizer actively maintained by Google and deeply integrated into Chrome and Android development. This strategic choice eliminates the need for BIN2TL to develop and maintain its own visualization engine, benefiting from Perfetto's advanced features, scalability, and ongoing support.
BIN2TL effectively addresses several critical pain points of traditional analysis:
- High-level overview: It provides an immediate, high-level understanding of a binary's execution flow, revealing the order and duration of major functions and internal calls.
- Dynamic Context: Unlike static analysis, it captures the actual runtime values of arguments and return values, which are crucial for understanding program logic.
- Multi-threading support: It accurately traces and visualizes the execution across multiple threads, a common challenge for traditional debuggers.
- Platform Agnostic (Binary Type): It supports both ELF (Executable and Linkable Format, common on Linux) and PE (Portable Executable, common on Windows) binary formats, making it broadly applicable.
- Low Overhead: Designed to minimize performance penalty during capture, ensuring that the observed behavior is as close as possible to native execution.
- Separation of Concerns: It clearly divides the capture phase from the analysis phase, allowing for flexible and repeatable analysis without re-executing the binary.
- Interactive Visualization: The use of Perfetto provides an interactive interface where users can zoom, pan, and query the trace data, enabling a deep dive into specific events or a broad overview of the entire execution.
By combining granular instrumentation with a powerful visualization backend, BIN2TL offers a compelling alternative to existing tools, promising to transform the efficiency and efficacy of dynamic binary analysis.
Technical Deep Dive
▶ Watch: Live demo: Tracing a binary and visualizing with Perfetto (16:40)
The technical foundation of BIN2TL rests on two primary components: Intel Pin for dynamic binary instrumentation and Perfetto (or the Chromium trace format) for data visualization. This combination allows for both highly granular data capture and an intuitive, interactive presentation.
Intel Pin serves as the Dynamic Binary Instrumentation (DBI) engine. Pin is a powerful framework developed by Intel that allows developers to create "PinTools" – dynamic program analysis tools that instrument executable code. When a program is run with Pin, Pin loads the target executable and injects instrumentation code at various points, such as before or after instructions, basic blocks, or function calls.
The speaker chose Pin for several key reasons:
- Granular Customizability: Pin offers extensive control over where and how instrumentation is applied. This includes callbacks at the instruction level, basic block level, image (module) load/unload level, and even for memory reads and writes. This fine-grained control is essential for capturing detailed execution dynamics like function arguments, return values, and precise timing.
- Active Maintenance: Despite its age (around 20 years), Pin is still actively maintained by Intel, ensuring its compatibility with modern operating systems and architectures.
- Accessible Overhead: Pin is designed to introduce relatively low overhead for instrumentation, which is critical for dynamic analysis tools where performance impact can significantly alter program behavior.
In contrast, other DBI tools like Frida were considered but deemed less suitable for BIN2TL's specific requirements. Frida, while powerful for hooking and runtime manipulation, typically operates at a higher level (e.g., function hooking via symbol lookup) and does not provide the same granular instruction-level or memory-level callbacks that Pin offers, which are crucial for BIN2TL's detailed tracing capabilities.
The instrumentation process within BIN2TL involves registering callback functions with Pin. For example, a callback can be set to execute every time a function is called or returns. Inside these callbacks, BIN2TL captures relevant information:
- Function Name: The name of the function being called or returned from.
- Arguments: The values passed to the function.
- Return Value: The value returned by the function.
- Thread ID: The identifier of the thread executing the function, crucial for multi-threaded analysis.
- Timestamp: High-resolution timestamps to accurately record start and end times for duration calculation.
This captured data is then converted into the Chromium trace format, which is natively supported by Perfetto. The Chromium trace format is a JSON-based format that represents events as a series of nested scopes, allowing for a hierarchical and time-based visualization. Each event includes a name, category, process ID, thread ID, timestamp, and optional arguments.
Perfetto is Google's open-source system-wide tracing tool, designed for performance analysis of Android, Linux, and Chrome. It provides a highly interactive web-based UI (ui.perfetto.dev, previously trace.cafe) for visualizing trace data. The choice of Perfetto was strategic:
- Integrated Ecosystem: Perfetto is deeply integrated into Google's development workflows, ensuring its long-term maintenance and evolution. This offloads the burden of visualizer development and maintenance from the BIN2TL project.
- Powerful Visualization: It offers rich, interactive timeline views, allowing users to zoom, pan, filter, and inspect detailed event information.
- SQL Query Support: A significant advantage is Perfetto's ability to execute SQL queries directly on the loaded trace data. This enables advanced analysis, such as finding specific call sequences, aggregating statistics, or identifying performance bottlenecks, without needing to process raw logs externally.
The overall workflow is:
- The user provides a binary (ELF or PE) to BIN2TL.
- BIN2TL loads the binary with Intel Pin, which injects the custom instrumentation code.
- As the binary executes, the PinTool captures dynamic events (function calls, returns, arguments, etc.) and writes them to an internal buffer.
- Once execution completes, the captured data is processed and converted into the Chromium trace format.
- This trace file can then be uploaded to
ui.perfetto.devfor interactive visualization and analysis.
This architecture ensures that BIN2TL provides a highly customizable, detailed, and visually intuitive dynamic analysis experience, leveraging battle-tested components for both instrumentation and visualization.
Demo / Proof of Concept
▶ Watch: Comparing BIN2TL against other binary analysis tools (22:00)
The presentation included several compelling demonstrations to illustrate BIN2TL's capabilities, showcasing its interactive output and the depth of information it provides.
The first demonstration involved a very simple C program featuring two functions, func_a and func_b. func_b was designed to perform a basic operation and return a value. When this binary was passed through BIN2TL, the output was an interactive trace visualized in the Perfetto UI. The speaker zoomed into the trace, highlighting the execution of func_a and func_b. Upon clicking on func_b within the timeline, the UI displayed detailed information, including the arguments passed to the function and its return value. The speaker explicitly noted that by checking the source code logic, these dynamically captured values were confirmed to be correct, validating BIN2TL's accuracy in extracting runtime context. This initial demo clearly illustrated how an analyst could quickly understand what arguments a function received and what it returned, information critical for reverse engineering. Furthermore, the Perfetto interface also displayed the duration of each function call, offering insights into performance and execution timing.
The second conceptual demonstration, while not fully live-run due to time and context considerations (originally intended to be a ransomware example, replaced with a generic threading example for the Japanese conference), showcased BIN2TL's ability to handle multi-threaded applications. The speaker presented a basic C threading example and explained that BIN2TL successfully captures and visualizes the execution flow across different threads. This is a significant advantage, as debugging multi-threaded applications with traditional tools like GDB can be notoriously difficult and confusing due to context switching and interleaved execution. BIN2TL's timeline view clarifies the interactions and parallel execution of threads, providing a much-needed overview.
A more comprehensive live demo was presented, detailing the end-to-end workflow:
- Binary Upload: The speaker showed the process of uploading a target binary to the BIN2TL system.
- Execution and Tracing: The system then executed the binary under Intel Pin instrumentation, capturing the dynamic trace data.
- Trace Upload: The generated trace artifact was automatically uploaded to a web-based Perfetto instance (specifically
trace.cafe, now typicallyui.perfetto.dev). - Interactive Analysis: The Perfetto UI loaded the trace. The speaker navigated through the interactive timeline, demonstrating how to identify the
mainfunction and subsequent calls to functions likeencryptanddecrypt(likely from a cryptographic library). The chronological order of these calls was immediately apparent.
The speaker emphasized that while static analysis tools like IDA Pro could technically reveal the potential for these function calls, BIN2TL provides a high-level, dynamic overview of actual execution order and timing without the need for repetitive debugging sessions. This allows analysts to quickly gain context, identify critical paths, and then, if necessary, switch back to IDA Pro or Ghidra for a deeper, static examination of specific code sections, without the overhead of restarting debuggers or painstakingly setting breakpoints. The demo effectively conveyed that BIN2TL serves as an excellent initial triage and contextualization tool, significantly streamlining the overall binary analysis workflow.
Defensive Implications
▶ Watch: Summary: BIN2TL's advantages and impact on analysis (26:50)
BIN2TL offers substantial benefits for defensive security operations, providing a powerful new lens through which to analyze and understand executable behavior. By transforming raw execution into an interactive timeline, defenders can more effectively identify malicious activity, understand vulnerabilities, and enhance their incident response capabilities.
- Malware Analysis and Triage:
- Rapid Behavioral Understanding: Defenders can quickly gain a high-level overview of how a suspicious binary executes. Instead of sifting through verbose debugger logs or struggling with obfuscated static code, BIN2TL immediately reveals the sequence of function calls, library interactions, and multi-threaded behavior. This accelerates the initial triage of malware samples, allowing analysts to identify key malicious functionalities (e.g., encryption, network communication, persistence mechanisms) much faster.
- Identifying Evasion: Malware often employs anti-analysis techniques or complex control flows. BIN2TL's dynamic visualization can expose these behaviors as they unfold, showing the actual execution path taken, even through convoluted or dynamically resolved code, which might be missed by static analysis.
- Argument and Return Value Inspection: The ability to see actual arguments passed to functions and their return values is invaluable. For instance, defenders can observe the parameters used in
CreateFile,RegSetValueEx, or cryptographic functions, directly revealing file paths, registry keys, or encryption keys without manual breakpointing.
- Vulnerability Research and Exploit Analysis:
- Understanding Exploit Primitives: When analyzing a vulnerability or an exploit, BIN2TL can illustrate the precise sequence of operations that lead to a crash or a controlled execution flow. This helps in understanding how an attacker manipulates program logic, what functions are called, and with what inputs, providing critical context for developing patches or detection signatures.
- Fuzzing Triage: After a fuzzer discovers a crash, BIN2TL can be used to trace the execution path leading up to the crash, helping to pinpoint the exact function and input that caused the issue, thereby accelerating the root cause analysis.
- Incident Response:
- Compromised System Analysis: When a suspicious executable is found on a compromised system, BIN2TL can be used to quickly analyze its behavior in a controlled environment. This provides immediate insights into its purpose, potential impact, and indicators of compromise (IOCs) that can be used for detection and remediation.
- Post-Mortem Analysis: For complex incidents, tracing the execution of attacker tools or custom malware can help reconstruct the attack chain and understand the full scope of the compromise.
- Security Tool Development and Validation:
- Behavioral Signature Generation: The detailed dynamic traces can be used to generate more accurate and robust behavioral signatures for intrusion detection systems or endpoint detection and response (EDR) solutions.
- Policy Enforcement Validation: Defenders can use BIN2TL to verify that security policies (e.g., Application Whitelisting) are correctly enforcing allowed behaviors by tracing approved applications and ensuring they do not deviate from expected execution paths.
By integrating BIN2TL into their analysis pipelines, defenders can move beyond static assumptions and fragmented dynamic insights, gaining a holistic, efficient, and deeply contextual understanding of binary execution. This empowers them to make faster, more informed decisions in the face of evolving threats.
Key Takeaways
- BIN2TL revolutionizes binary analysis by converting dynamic program execution into an interactive, visual timeline using Intel Pin for instrumentation and Perfetto for visualization.
- It addresses the limitations of traditional static and dynamic analysis by providing a high-level, chronological overview of execution, including function calls, arguments, return values, and durations, with minimal overhead.
- The tool supports both ELF and PE binary formats, making it versatile for analyzing executables across different operating systems.
- By leveraging the actively maintained Perfetto (Chromium trace format) ecosystem, BIN2TL benefits from advanced visualization features, scalability, and built-in SQL query capabilities for deep trace analysis.
- BIN2TL significantly streamlines the reverse engineering and malware analysis workflow, allowing defenders to quickly understand complex or multi-threaded program behavior and identify critical actions without repetitive, time-consuming debugging sessions.
- It enables a more efficient analysis cycle, where analysts can gain initial dynamic context from BIN2TL before diving into specific code sections with static analysis tools like IDA Pro or Ghidra.
About the Speaker(s)
Michael Telloyan is an undergraduate student currently working at Mandian. His professional interests span both engineering and reverse engineering, showcasing a versatile skill set in understanding and manipulating software at a fundamental level. Michael has a notable background in competitive cybersecurity, having participated in various Capture The Flag (CTF) competitions, including prominent events like DEF CON CTFs and other onsite challenges. He is currently involved in a significant project at Mandian called Xer, which aims to abstract popular binary analysis platforms such as Ghidra, IDA Pro, and Binary Ninja into a unified Pythonic framework. This framework would allow for interchangeable backends, providing greater flexibility and efficiency for binary analysis tasks.
Reviews
Dr. Zero (Offensive Security Researcher) — SOLID
Undergraduate builds a sensible integration of Intel Pin + Perfetto to visualize binary execution timelines. It's useful tooling, clearly presented, but it's glue code between two mature projects rather than novel research. The technique is sound; the contribution is incremental.
Heather Calloway (CISO) — SOLID
A practical tooling contribution that solves a real workflow problem for malware analysts and reversers. Useful for teams doing regular binary triage, but it's incremental improvement to existing workflows rather than a strategic shift. Worth flagging to your threat intel or IR leads if they're drowning in manual debugging time.