Forecasting Vulnerability Sightings Under Data Scarcity: Modeling Sparse and Bursty Cyber Threat ...
Alexandre Dulaunoy (CIRCL), Cédric Bonhomme (CIRCL)
FIRST Cyber Threat Intelligence Conference 2026 (#FIRSTCTI26)
Overview
In an era of rapidly escalating cyber threats and an overwhelming volume of vulnerability disclosures, security professionals face a critical challenge: identifying which vulnerabilities truly matter amidst the noise. Alexandre Dulaunoy and Cédric Bonhomme from CIRCL presented their work on forecasting vulnerability sightings, an approach designed to address this problem under conditions of data scarcity. Their talk, "Forecasting Vulnerability Sightings Under Data Scarcity: Modeling Sparse and Bursty Cyber Threat...", introduces the tard-s toolkit, an open-source solution built on CIRCL's extensive Vulnerability Lookup platform.
Key moments
- 4:00 The challenge of forecasting vulnerability 'stings'
- 6:00 Forecasting challenges: sparse, bursty, short time series
- 11:00 Initial attempt with SARIMAX and its limitations
- 16:00 Adaptive model selection for different vulnerability trends
- 19:40 Tard s complements EPSS for vulnerability activity forecasting
- 24:00 Future work: weighting stings by source and type
- 30:50 Q&A: Correlating sting patterns with actual exploitation
Forecasting Vulnerability Sightings Under Data Scarcity: Modeling Sparse and Bursty Cyber Threat ...
Speakers: Alexandre Dulaunoy (CIRCL); Cédric Bonhomme (CIRCL)
Conference: FIRST CTI Conference
YouTube: https://www.youtube.com/watch?v=ZmJocK3xpsE
Overview
In an era of rapidly escalating cyber threats and an overwhelming volume of vulnerability disclosures, security professionals face a critical challenge: identifying which vulnerabilities truly matter amidst the noise. Alexandre Dulaunoy and Cédric Bonhomme from CIRCL presented their work on forecasting vulnerability sightings, an approach designed to address this problem under conditions of data scarcity. Their talk, "Forecasting Vulnerability Sightings Under Data Scarcity: Modeling Sparse and Bursty Cyber Threat...", introduces the tard-s toolkit, an open-source solution built on CIRCL's extensive Vulnerability Lookup platform.
The core of their research lies in leveraging "sightings" – mentions and discussions of vulnerabilities across various sources, including social networks, forums, and specialized threat intelligence feeds – as a dynamic indicator of emerging risk. Unlike static severity scores or long-term exploitation predictions, sighting data is often sparse, bursty, and available only for short periods, rendering traditional time series forecasting models ineffective. This talk details CIRCL's innovative adaptive modeling approach, which combines simpler, context-aware models to provide actionable, short-term forecasts, helping defenders prioritize vulnerabilities before they lead to widespread exploitation.
Background
▶ Watch: The challenge of forecasting vulnerability 'stings' (4:00)
The foundation of this research is Vulnerability Lookup, an open-source software platform developed by CIRCL over the past two years. This robust system aggregates vulnerability data from 70 to 75 diverse sources, including the National Vulnerability Database (NVD), CISA, and various Computer Emergency Response Teams (CERTs). It serves as the backend for the Global Cybersecurity Vulnerability (GCV) program and currently manages over 2 million software vulnerabilities, a number that is "significantly increasing." The primary goal of Vulnerability Lookup is to provide a unified platform for security professionals to search, triage, and track software product vulnerabilities, a necessity given the explosion of new vulnerabilities, particularly with the rise of AI-related findings.
While handling the sheer volume of data was an initial design challenge, a more complex problem emerged: how to prioritize vulnerabilities. With millions of entries, analysts struggle to identify "which one is important for me." Traditional scoring mechanisms, while useful, often lag behind real-world attention and potential exploitation. This is where the concept of vulnerability sightings becomes crucial. Sightings are defined as references, discussions, or mentions of vulnerabilities across social networks, forums, and other intelligence sources. These are considered "real evidences" that a vulnerability might be gaining importance, potentially signaling a higher risk or impending exploitation. For instance, a vendor might initially downplay a vulnerability, only for it to be fully exploited months later; early sightings could serve as a critical warning.
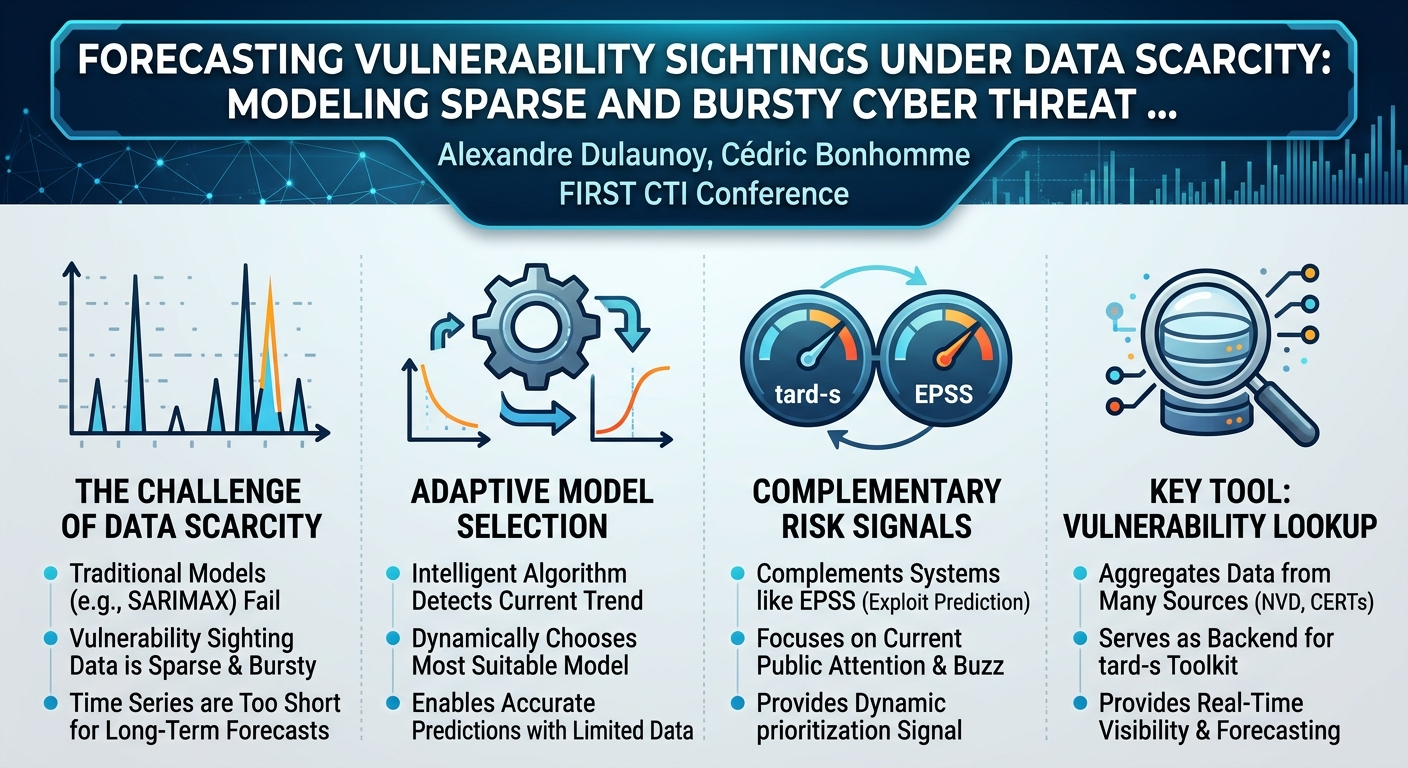
However, modeling these sightings presents significant challenges. The data is inherently sparse – many vulnerabilities receive very few mentions. It is also bursty, characterized by sudden, intense spikes in activity, often due to social network dynamics or the initial disclosure of a critical vulnerability. Furthermore, the time series are short; for newly identified vulnerabilities, there might only be a few days or weeks of sighting data, which is insufficient for conventional long-term forecasting models. As Alexandre Dulaunoy noted, even "10 days of sightings on a specific vulnerability" is considered valuable for an analyst, but it's a meager dataset for most algorithms. These factors make many traditional time series algorithms "unreliable," prompting CIRCL to seek new approaches. To enhance their models, CIRCL also leverages exogenous indicators, such as their open-source VLI (Vulnerability Labeling Indicator) model, which automatically estimates the severity of a vulnerability based on historical data and is integrated into Vulnerability Lookup.
Key Findings
▶ Watch: Initial attempt with SARIMAX and its limitations (11:00)
The research presented by CIRCL highlights several crucial findings regarding the forecasting of vulnerability sightings:
- Ineffectiveness of Traditional Time Series Models: Classic models like SARIMAX (Seasonal AutoRegressive Integrated Moving Average with eXogenous regressors), while well-established for long, continuous time series, proved largely unsuitable for vulnerability sighting data. SARIMAX required extensive historical observations (e.g., 30-60 days minimum, ideally years) to provide reliable forecasts. For the sparse, bursty, and short-term data typical of new vulnerability sightings, SARIMAX generated wide confidence intervals, frequently produced negative results (requiring logarithmic transformations and bounding), and often converged to zero, making it impractical for timely analysis.
- Suitability of Simpler, Adaptive Models: CIRCL found that simpler, non-linear models, specifically the DKI Model (Decay Model) and the Logistic Growth Model, were far more effective. The Logistic Growth Model is adept at capturing the initial rise in attention for a vulnerability, while the DKI Model is designed to track the subsequent decline in buzz after its peak. These models are better suited for the distinct phases of a vulnerability's lifecycle in public discourse.
- Adaptive Model Selection is Key: The most significant contribution is an adaptive model selection mechanism. This intelligent algorithm automatically detects the trend of vulnerability sightings (rising, falling, or flattening) and dynamically chooses the most appropriate model (Logistic Growth or DKI) for forecasting. This adaptive approach allows for accurate predictions even with very short data windows, such as weekly observations, outperforming traditional time series analysis in these scenarios.
- Complementary to EPSS: The CIRCL model, tard-s, is not a competitor but a complement to systems like EPSS (Exploit Prediction Scoring System). While EPSS predicts the likelihood of exploitation within a 30-day window, tard-s focuses on "how much you have to worry about" a vulnerability and "for how long" based on current communication and sighting activity. Combining these two perspectives offers a more holistic view of risk, integrating both real-time buzz and predicted exploitation.
- Importance of Data Quality and Weighting: The quality of the time series data, including the distinction between the date of acquisition and the date of publication, is critical. Furthermore, the research identified the potential for significant improvement by weighting different sighting sources. For instance, mentions from platforms like Shadow Server, Nuclei, or Metasploit often represent stronger signals (e.g., in-the-wild exploitation attempts) compared to general social network buzz, suggesting a need for differential treatment in future model iterations.
Technical Deep Dive
▶ Watch: Adaptive model selection for different vulnerability trends (16:00)
The technical core of CIRCL's work revolves around developing a robust forecasting system for vulnerability sightings, integrated with their Vulnerability Lookup platform. This platform acts as the central data collection and management hub, aggregating over 2 million vulnerability records from 70-75 sources including NVD, CISA, and various CERTs. The challenge, as articulated, was to move beyond mere data collection to actionable intelligence, specifically identifying which vulnerabilities demand immediate attention.
The chosen signal for this purpose is vulnerability sightings – mentions, discussions, and references to specific CVEs across a wide array of sources, from mainstream social media (like Mastodon, BlueSky, forums) to specialized threat intelligence feeds (such as Shadow Server, Nuclei, MISP, Metasploit). These sightings serve as evidences of a vulnerability's growing importance, potentially preceding widespread exploitation.
Initial Approaches and Their Limitations
CIRCL initially explored established time series forecasting models, beginning with SARIMAX. This choice was influenced by prior research, such as work by Lev and R, who successfully used ARIMA (the foundation of SARIMAX) for long-term CVE prediction over 30-year datasets. CIRCL's innovation was to introduce VLI (Vulnerability Labeling Indicator) scores as an exogenous parameter into SARIMAX, leveraging their observation of a correlation between VLI severity and social buzz.
However, SARIMAX proved largely inadequate for the specific characteristics of vulnerability sighting data:
- Data Scarcity: Unlike the decades of data available for long-term CVE trends, new vulnerability sightings often provide only "around 10 days of sightings" – far too short for SARIMAX to generate reliable forecasts. It typically requires "at least maybe 30 even 60 days of collection of data."
- Sparsity and Bursty Nature: The intermittent and sudden spikes in sighting data (e.g., after a major disclosure) caused SARIMAX to produce "huge" confidence intervals, making predictions unreliable.
- Negative Predictions: SARIMAX could output negative values for sightings, which is illogical. While this was mitigated using logarithmic transformations and bounding methods, it indicated a fundamental mismatch with the data distribution.
- Overestimation: During periods of high burstiness, SARIMAX tended to "largely overestimate" future sightings, being overly influenced by recent peaks.
Following SARIMAX, CIRCL experimented with other non-linear regression models, which offered some improvements, particularly in handling shorter time series and avoiding negative integer predictions. However, these models still struggled with the extreme burstiness, often overestimating future values following a sudden surge in sightings.
The Adaptive Model Selection Approach
Recognizing the limitations of complex, static models, CIRCL pivoted to a more adaptive strategy utilizing two simpler, context-specific models:
- DKI Model (Decay Model): This model is designed for scenarios "after the peak of vulnerability," when a vulnerability's buzz is diminishing. It models the natural decay of attention.
- Logistic Growth Model: This model is employed when a vulnerability is newly published and "really starting and getting a lot of information from various sources." It captures the characteristic S-curve of early, rapid adoption and subsequent plateau in attention.
The innovation lies in the adaptive model selection mechanism. This algorithm continuously monitors the observed sighting data and, based on its trend (rising, falling, or flattening), automatically determines which of the two models (DKI or Logistic Growth) is most appropriate for the current phase. This dynamic selection ensures that the chosen model best fits the immediate context of the vulnerability's public discourse. The system then provides a forecast, typically for a "period of 10 days," which is configurable.
This trend detection and adaptive model selection are now integrated into Vulnerability Lookup. Users visiting the sighting page for a specific CVE on vulnerability.circle.lu can see the calculated trend and predictions, observing how the forecast evolves as more sightings emerge.
Differentiation from EPSS and Future Directions
The speakers emphasized that their tard-s framework is distinct from, and complementary to, systems like EPSS (Exploit Prediction Scoring System). EPSS aims to predict exploitation within a 30-day window, often using different, sometimes closed-source, data points. In contrast, tard-s focuses on the intensity and duration of public attention, answering "how much you have to worry about" a vulnerability and "for how long." Combining both offers a richer risk assessment.
Future technical enhancements include:
- Weighted Sighting Sources: Currently, all sightings are treated equally. CIRCL plans to assign different weights based on the source's reliability and signal strength. For example, a mention from Shadow Server or a Metasploit module might indicate a much stronger signal of active exploitation or high interest than a general tweet.
- Exogenous Variables: Exploring other external variables, such as "CVE days" (time since disclosure) or vendor-specific publication patterns (e.g., Microsoft's patch Tuesday), to further refine forecasts.
- Cross-Vulnerability Predictions: While the current model predicts per vulnerability, future work might explore lateral predictions across vulnerability types (e.g., based on CPE or exploitation types) to leverage larger datasets.
The tard-s toolkit, along with the underlying NLP models for automatic classification, is open-source and available on Hugging Face, enabling the community to leverage and contribute to these advancements. The entire ecosystem, including Vulnerability Lookup and ML Gateway for inference, is designed for reproducibility and integration into various vulnerability management systems.
Demo / Proof of Concept
▶ Watch: Future work: weighting stings by source and type (24:00)
While the talk did not feature a live, interactive demonstration during the presentation, the speakers highlighted its integration into their public-facing platform, vulnerability.circle.lu, which serves as an instance of the Vulnerability Lookup software. This integration serves as the primary proof of concept for the tard-s forecasting toolkit.
Users visiting the sighting page for any vulnerability on this platform can observe the calculated trend and predictions. The system displays the detected trend (e.g., rising, falling, or flat) and provides a forecast for future sightings. This allows security analysts to see the real-time application of the adaptive model selection mechanism and how predictions evolve as new sighting data becomes available. The speakers encouraged attendees to explore the website to see these features in action, demonstrating that the research has moved beyond theoretical models into practical, deployable tools.
Defensive Implications
▶ Watch: Q&A: Correlating sting patterns with actual exploitation (30:50)
The forecasting of vulnerability sightings, as presented by CIRCL, offers significant defensive implications for organizations striving to manage the overwhelming volume of cyber threats:
- Dynamic Prioritization: Traditional vulnerability management often relies on static metrics like CVSS scores, which can be slow to update and don't always reflect real-world attention or exploitation potential. The tard-s system provides a dynamic, real-time signal based on public discourse. Defenders can use these forecasts to prioritize vulnerabilities that are currently trending or gaining buzz, even if their CVSS score is moderate, thereby allocating patching and mitigation resources more effectively.
- Early Warning System: By tracking "sightings" from diverse sources, including social media and specialized threat intelligence feeds (e.g., Shadow Server, Nuclei), organizations can gain an earlier warning about emerging threats. A surge in sightings for a newly disclosed vulnerability might indicate rapidly increasing interest from threat actors, long before official exploitation metrics (like EPSS) are available or before widespread attacks are observed. This allows for proactive defense rather than reactive response.
- Enhanced Threat Intelligence: The system complements existing threat intelligence feeds by adding a layer of communicative intelligence. Knowing "how much you have to worry about" a vulnerability based on public discussion provides crucial context that can inform threat hunting, incident response, and security monitoring efforts. Security teams can use these insights to focus their efforts on specific CVEs that are likely to become more critical in the near term.
- Resource Optimization: With limited resources, security teams constantly battle to decide where to focus their efforts. The ability to forecast which vulnerabilities are likely to become "strong topics in the next next time" empowers organizations to optimize their security investments. This includes prioritizing vulnerability research, patching cycles, security control deployments, and even employee awareness campaigns around specific, trending threats.
- Complementary Risk Assessment: The speakers explicitly positioned tard-s as complementary to the EPSS (Exploit Prediction Scoring System). Defenders should integrate both. While EPSS predicts the likelihood of exploitation, tard-s indicates the level of current and projected attention/buzz. A vulnerability with high tard-s forecast but low EPSS might warrant monitoring, while one with high scores in both would demand immediate action. This layered approach provides a more comprehensive and nuanced understanding of risk.
- Improved Situational Awareness: By visualizing vulnerability trends and forecasts within platforms like Vulnerability Lookup, security analysts gain improved situational awareness. They can quickly identify "trending" vulnerabilities that might otherwise be lost in the sheer volume of disclosures, enabling more informed decision-making and a more agile security posture.
- Data-Driven Decision Making: The entire approach encourages a shift towards more data-driven vulnerability management. Instead of relying solely on static scores or anecdotal evidence, organizations can leverage quantitative forecasts derived from real-time threat intelligence to make more objective and defensible security decisions.
Key Takeaways
- Traditional time series forecasting models like SARIMAX are largely ineffective for predicting vulnerability sightings due to the inherent sparsity, burstiness, and short time series characteristics of this data.
- CIRCL's tard-s toolkit employs an adaptive model selection mechanism, dynamically choosing between simpler Logistic Growth and DKI (Decay) models based on the observed trend of vulnerability sightings (rising, falling, or flat).
- This adaptive approach enables reliable, short-term forecasting of vulnerability buzz, even with limited data (e.g., weekly windows), outperforming classical time series analyses in such scenarios.
- Vulnerability sighting forecasts provide a crucial, dynamic signal for prioritization in vulnerability management, indicating "how much to worry about" a vulnerability and "for how long," complementing static severity scores and exploitation prediction systems like EPSS.
- The Vulnerability Lookup platform serves as the open-source backbone for collecting and processing vulnerability data and integrating these forecasting capabilities, making the insights accessible to the security community.
- Future enhancements will focus on weighting different sighting sources (e.g., giving higher importance to mentions from Shadow Server or Metasploit due to stronger signals) and exploring broader cross-vulnerability predictions to further refine accuracy and utility.
About the Speaker(s)
Alexandre Dulaunoy and Cédric Bonhomme are both associated with CIRCL (Computer Incident Response Center Luxembourg), a government-backed CERT that plays a pivotal role in cybersecurity incident response and threat intelligence. Their work, as demonstrated in this presentation, focuses on developing practical, open-source solutions to address complex challenges in vulnerability management. They lead the development of the Vulnerability Lookup platform, an EU-funded initiative that aggregates and processes vast amounts of vulnerability data. Their expertise lies in applying data science and machine learning techniques to cybersecurity problems, with a strong emphasis on creating tools that are both technically sophisticated and readily usable by the wider security community. They are authors of academic papers related to their research, available on platforms like archive.org, showcasing their commitment to advancing the field through scientific inquiry and open collaboration.
Reviews
Dr. Zero (Offensive Security Researcher) — SOLID
Honest applied research from a team that actually runs infrastructure. They tried SARIMAX, it failed predictably on sparse bursty data, so they pivoted to simpler adaptive models. Not novel methodology, but useful engineering for a real operational problem.
Heather Calloway (CISO) — SOLID
Useful work on a real problem — prioritizing vulnerabilities when you're drowning in CVEs. The adaptive model selection is clever and the open-source tooling is ready to use. But this is a niche capability enhancement, not a program-changing insight. Worth your vuln management team's time, not your board's.
→ Top-rated talks at FIRST Cyber Threat Intelligence Conference 2026 (#FIRSTCTI26)
All talks from FIRST Cyber Threat Intelligence Conference 2026 (#FIRSTCTI26)