Benchmarking Your Constituency: A Practical Framework for CERTs with Results from Academic Sector
Juha Haaga (Arctic Security)
Overview
In the realm of cybersecurity, understanding the security posture of an entire constituency or industry sector is a formidable challenge. Juha Haaga, from Arctic Security, presented a compelling framework at FIRSTCON designed to enable CERTs (Computer Emergency Response Teams) to benchmark their constituents effectively. This talk, born from Haaga's "hobby project," addresses a critical gap: the lack of actionable, auditable, and context-rich security benchmarking data for broad sectors, unlike the vendor-specific ratings prevalent in the commercial space.
Key moments
- 0:00 Introduction and the need for benchmarking
- 5:50 Limitations of commercial security ratings for CSIRTs
- 12:20 The practical framework for security benchmarking
- 25:50 Averages are misleading; focus on data distributions
- 32:00 National differences in security posture across European academia
- 35:00 Key checklist for building a robust benchmarking system
- 40:00 Q&A: Identifying and addressing "low-hanging fruit" issues
Benchmarking Your Constituency: A Practical Framework for CERTs with Results from Academic Sector
Speakers: Juha Haaga, Arctic Security
Conference: FIRSTCON
YouTube: https://www.youtube.com/watch?v=hoZh5N9rT1U
Overview
In the realm of cybersecurity, understanding the security posture of an entire constituency or industry sector is a formidable challenge. Juha Haaga, from Arctic Security, presented a compelling framework at FIRSTCON designed to enable CERTs (Computer Emergency Response Teams) to benchmark their constituents effectively. This talk, born from Haaga's "hobby project," addresses a critical gap: the lack of actionable, auditable, and context-rich security benchmarking data for broad sectors, unlike the vendor-specific ratings prevalent in the commercial space.
Haaga's work provides a practical, data-driven methodology for CERTs to gain deep insights into their target populations. By analyzing the academic sector across the US and Europe as a case study, he demonstrates how to identify industry-wide issues, track progress over time, and motivate improvements among diverse organizations. The framework’s utility extends beyond academia, promising a new level of strategic capability for CERTs tasked with enhancing the collective security of their respective sectors.
The talk highlights the difficulties inherent in such large-scale benchmarking, including data harmonization, accurate asset attribution, and the need for continuous, low-false-positive data streams. Ultimately, Haaga's framework offers a blueprint for CERTs to move beyond anecdotal observations, providing concrete KPIs and a clear understanding of where to invest resources for the greatest impact on their constituency's cybersecurity resilience.
Background
▶ Watch: Introduction and the need for benchmarking (0:00)
The motivation behind this benchmarking framework stems from recurring questions faced by CERTs and their constituents. Organizations frequently inquire about their security performance relative to peers, the prevalent problems in their industry, and the most impactful areas for investment. Without a clear understanding of the collective security posture, it's challenging for CERTs to demonstrate the impact of their efforts or for constituents to prioritize their security spending. Traditional security ratings, while useful for vendor risk management, fall short for CERTs due to issues with actionability, attribution accuracy, auditability, and their black-box nature. These ratings are often not designed for sector-wide analysis or for providing granular insights that CERTs need to guide their operations.
Benchmarking, while desirable, is fraught with practical difficulties. Firstly, data is often unstructured and requires significant effort to categorize and harmonize. Secondly, effective benchmarking demands a broad context, comparing a constituency not just against itself but against the wider internet or similar sectors. Thirdly, accurate asset inventory is crucial, yet many organizations, let alone entire sectors, struggle to maintain a comprehensive list of their digital assets. Lastly, a sufficiently broad data scope is necessary; without data covering a significant portion of the internet, any benchmark becomes statistically unreliable.
Haaga's personal journey into this problem space was significantly influenced by his work with academic institutions over the past four years. He recognized academics as an ideal "canary" for this research due to their highly complex and often unruly networks, which present a rich dataset of security challenges. This complexity, he reasoned, would validate the framework's applicability to other industries, where networks might be more controlled. His approach leverages readily available data sources, including those accessible to many CERTs like Shadow Server (though he had to use commercial alternatives for his personal project), to overcome these inherent challenges and build a robust, practical benchmarking system.
Key Findings
▶ Watch: The practical framework for security benchmarking (12:20)
Haaga's research into benchmarking the academic sector yielded several critical insights:
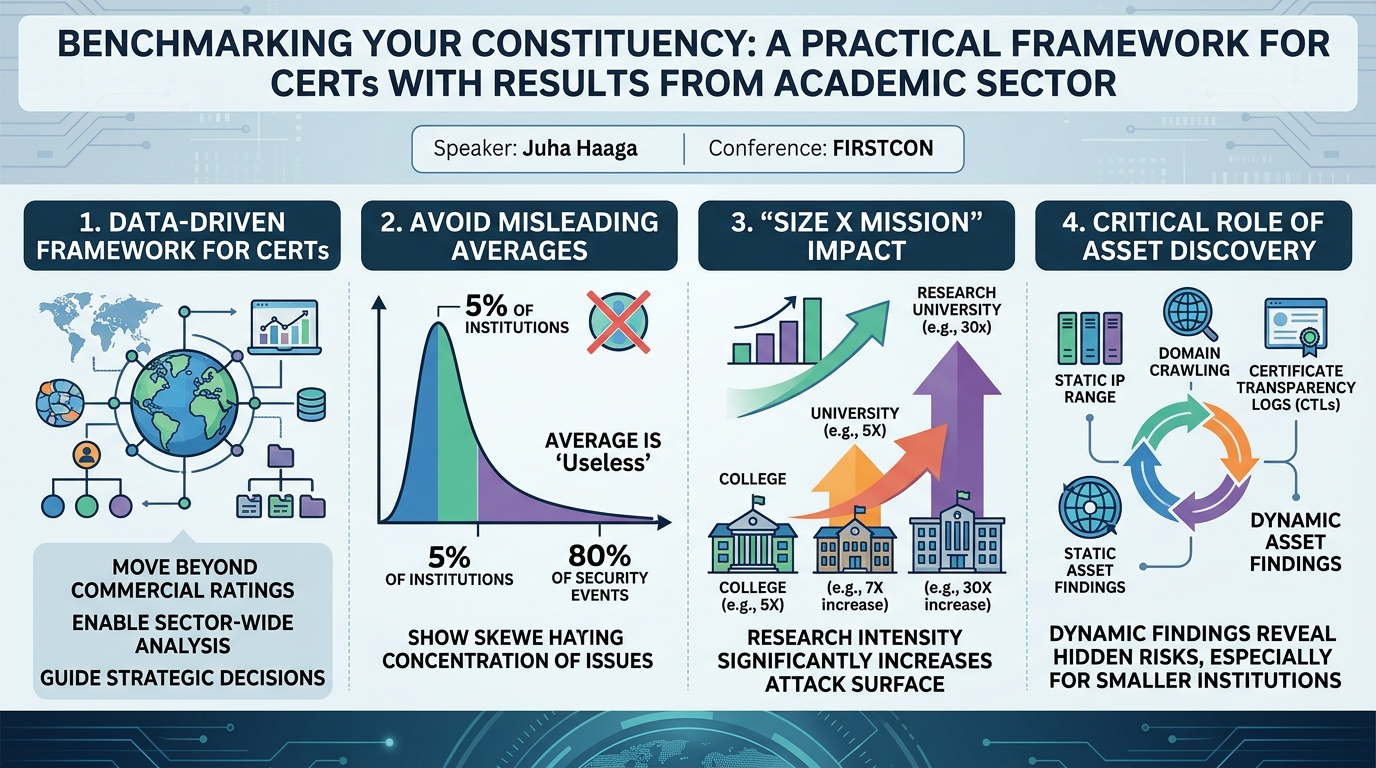
- The "Size x Mission" Equation: The most significant finding was the strong correlation between an institution's size, its mission, and its cybersecurity footprint. Larger institutions, particularly research universities, exhibited a disproportionately higher number of security issues. While a very large college might show a 5x increase in issues compared to a very small one, this jumped to a 30x increase for research universities. Furthermore, comparing research universities to "normal" universities revealed a 7x increase in findings, underscoring that the nature of an institution's activities (e.g., extensive research, open collaboration, diverse user base) significantly impacts its attack surface and susceptibility to issues.
- Averages Lie, Distributions Reveal: Haaga emphatically stated that averages are "very useless" for this type of benchmarking. Instead, distributions provide a much more accurate and helpful comparison. His data showed a highly skewed distribution, with approximately 5% of academic institutions accounting for 80% of all observed security events in the higher education space. The median number of events was 79, highlighting that a small number of outliers dominate the overall issue count. This finding is crucial for CERTs, as it directs attention to a concentrated segment of their constituency that requires significant intervention.
- Dynamic vs. Static Asset Findings: The research differentiated between issues found on static IP addresses (registered network ranges) and those discovered through dynamic asset discovery (e.g., subdomains resolving to dynamic IPs). For smaller institutions, almost half of the security findings (around 50%) were on dynamically discovered assets, meaning they lacked dedicated static IP ranges. This proportion decreased significantly for larger institutions, where most findings were on static assets. This emphasizes the need for comprehensive asset discovery methods, including Certificate Transparency Logs (CTLs) and Passive DNS, to avoid missing a substantial portion of a constituency's security issues, especially for smaller entities.
- Regional Differences in Exposure: Comparing US and European academic institutions against the global data set, Haaga found that US institutions accounted for 2.28% of global findings, while European institutions accounted for 1.83%. This suggests that academic networks globally host upwards of 10% of all internet security findings. More specifically:
- Public Exposure: US institutions had two times more public exposure findings per institution than European ones.
- Known Vulnerabilities: Both regions were almost equal, with 1.2% of findings related to known vulnerabilities.
- Suspected Compromise: European institutions showed 1.8 times more suspected compromise findings. However, Haaga noted this could be an artifact of his dataset, as the commercial sources he used for compromise data were predominantly European.
- Prevalent Service Categories: Analysis of the types of services accounting for findings revealed that a few categories dominate:
- MS HTTP and Peer TLS constituted about 60% of all findings.
- Excluding these, other significant categories included remote access services (7.5%), file and print services (5.8%), management UIs (5.6%), and databases (2.5%). This long tail of specific services indicates a broad range of misconfigurations and vulnerable software being exposed.
- Cross-Border Comparisons and Outliers: Country-level comparisons within Europe demonstrated interesting differences. While larger countries like Germany naturally had more findings, some smaller countries like Czechia and Sweden appeared to have disproportionately high numbers relative to their size. These outliers often point to specific institutions or widespread issues (e.g., a university exposing "a ton of MSRP C devices" in Sweden, or a US university exposing "a ton of Microsoft-related infrastructure directly to the internet"), which can be targeted for direct intervention.
Technical Deep Dive
▶ Watch: Averages are misleading; focus on data distributions (25:50)
The core of Juha Haaga's presentation revolved around a practical framework for benchmarking, built upon several foundational components and a structured process.
Foundational Components
- Authoritative Organization Registries:
- US: Haaga leveraged the National Center for Education Statistics (NCES), which provides a comprehensive dataset including organization names, domain names, student enrollment, and institution types.
- Europe: He used the European Tertiary Education Register (ETER) to mine similar organizational data across European countries.
- These registries served as the initial "ground truth" for identifying and classifying academic institutions.
- Comprehensive Asset Discovery:
- Domain Crawling: To identify all aliases and related domains, Haaga performed domain crawling on the initial list of EDU domains and European register domains. This involved analyzing website "about" pages to discover alternative names institutions used for themselves.
- Certificate Transparency Logs (CTLs): These logs were crucial for discovering subdomains and associated IP addresses, providing a broad view of an organization's exposed attack surface.
- IP-to-Organization Databases: These databases helped attribute static network ranges to specific institutions, overcoming the challenge of often messy and inconsistent human-entered registration data (e.g., "seven different ways to mistype an organization name").
- Passive DNS (Acknowledged but Limited): While Haaga recognized Passive DNS as a powerful tool for discovering 5 to 10 times more IP addresses associated with subdomains, its cost limited its extensive use in his hobby project. He estimated that using Passive DNS would reveal approximately 2.7 million IP addresses in use in the US and 2.2 million in Europe for academic institutions.
- Data for Analysis:
- Haaga identified four key criteria for the security data used in benchmarking:
- Global: The data must be uniform across all geographical regions to enable cross-border comparisons.
- Complete: It must cover the entire IP address space to ensure no significant portions of the internet are missed.
- Continuous: The data source must provide a steady stream of information over time, allowing for month-over-month tracking and trend analysis.
- Low False Positive Rate: The data must be highly reliable, as benchmarking with inaccurate or noisy data would be "completely useless."
- Sources: Since he didn't have access to Shadow Server (which he noted most CERTs do), Haaga utilized Shodan and other commercial global scanning datasets that met his criteria.
The Benchmarking Framework Steps
- Classification: Based on official statistical data, institutions were classified by:
- Type: Research university, college, teacher academy, vocational school, etc. This was shown to be critical, as different types have vastly different security profiles.
- Size: Student enrollment numbers were used to define size categories (e.g., 500 students vs. 50,000 students), recognizing that scale fundamentally alters an organization's security posture.
- Location: Country-level and US state-level comparisons were enabled by geographical classification.
- Asset Profiles: Differentiating between institutions with large static IP network ranges (e.g., multiple /16 blocks) and those relying on dynamic addresses from ISPs.
- Categorization of Issues: A high-level taxonomy was applied to harmonize the collected security data:
- Known Vulnerabilities: Detectable vulnerabilities on exposed hosts.
- Public Exposure: Services or systems that should not be internet-facing but are.
- Suspected Compromise: Indicators of malware-related activities or scanning originating from institutional networks.
This uniform bucketing allowed for consistent comparison across diverse organizations.
- Asset Attribution (AI System): An AI system was employed to match discovered assets (domains, IPs) against the registered names of network owners and link them to the correct institutions from the source datasets. This step was vital for overcoming the "not trivial" problem of human-entered typos and variations in IP registration databases.
- Data Normalization: This was a critical and complex step, especially given the variable nature of some commercial data sources (e.g., Shodan's event volume fluctuating from 10 million to 5 million events on different days).
- Time Normalization: Data was normalized over time so that each day appeared to have the same volume relative to the organizations being tracked. This prevented artificial spikes or dips in findings due to scanner cadence rather than actual security changes.
- Subcategory Normalization: If one category of data (e.g., vulnerabilities) changed independently of another (e.g., public exposure), these categories were normalized separately to maintain accurate trend tracking.
This detailed, multi-layered framework, while initially applied to academia, is designed to be highly adaptable. It provides a structured approach to transform raw, disparate security data into actionable intelligence for CERTs seeking to benchmark and improve the collective security posture of any defined constituency.
Demo / Proof of Concept
▶ Watch: Key checklist for building a robust benchmarking system (35:00)
While the talk did not feature a live, interactive demonstration in the traditional sense, the entire presentation served as a robust proof of concept for the proposed benchmarking framework. Juha Haaga meticulously walked the audience through the methodology, data collection, and the resulting analytical outputs from his study of US and European academic institutions.
The "results" section of his talk effectively functioned as the demonstration, showcasing the framework's ability to:
- Quantify the scale of a constituency: Identifying 3,400 US and 5,548 European academic institutions, along with their static IP footprints (34 million US, 54 million Europe).
- Illustrate the impact of classification: Showing how institution type (college vs. research university) and size dramatically altered the number of security findings (e.g., 5x increase for large colleges, 30x for large research universities).
- Visualize data distributions: Presenting graphs that clearly demonstrated the skewed nature of security issues, where 5% of institutions accounted for 80% of all events, and highlighting the difference between static and dynamic asset findings.
- Provide comparative analysis: Displaying cross-regional comparisons (US vs. Europe) for public exposure, known vulnerabilities, and suspected compromise, and offering country-level breakdowns within Europe for unique IP addresses with issues.
- Identify specific problem areas: Listing prevalent service types like remote access, file and print services, and management UIs as significant sources of findings.
Through these detailed results and analytical visualizations, Haaga demonstrated the framework's practical utility in uncovering actionable insights, identifying outliers, and providing a factual basis for strategic security interventions within a large and complex constituency. The compelling data points, such as the specific percentages of global findings attributable to academia and the breakdown of problematic services, served as concrete evidence of the framework's effectiveness.
Defensive Implications
▶ Watch: Q&A: Identifying and addressing "low-hanging fruit" issues (40:00)
The benchmarking framework presented by Juha Haaga offers profound defensive implications for CERTs and the constituencies they serve. By adopting this methodology, defenders can move from reactive incident response to proactive, data-driven security improvement across an entire sector.
- Strategic Resource Allocation: The finding that 5% of institutions account for 80% of issues is a game-changer. Instead of broadly scattering resources, CERTs can identify these high-impact outliers within their constituency and direct targeted assistance, advisories, or even direct intervention. This allows for a much more efficient use of limited cybersecurity resources. For example, knowing that a specific university in Virginia is a "huge outlier" due to exposing "a ton of Microsoft-related infrastructure" allows a national CERT to engage directly with that institution to mitigate a significant portion of sector-wide risk.
- Prioritized Mitigation Efforts: The detailed breakdown of prevalent service categories (e.g., remote access, file and print, management UIs, databases) provides a clear roadmap for what to fix first. If a CERT knows that remote access services constitute 7.5% of findings and are disproportionately exposed, they can issue specific warnings, configuration guides, or even host workshops focused on securing these particular services. This moves beyond generic advice to addressing the most common and impactful vulnerabilities.
- Tailored Communication and Motivation: Benchmarking results provide concrete data points for communicating with constituents. Instead of vague exhortations to "do better," CERTs can show organizations how they compare to their peers, both positively and negatively. Presenting a distribution of findings rather than just an average helps institutions understand their position relative to similar organizations (e.g., a small college compared to other small colleges, not to a large research university). This can motivate underperforming entities to improve and provide a benchmark for those doing well to maintain their posture.
- Tracking Progress and Demonstrating Impact: The continuous nature of the data collection and normalization allows CERTs to track the collective security posture of their constituency over time. This provides invaluable KPIs to demonstrate the effectiveness of their programs, initiatives, and advisories. If a CERT launches a campaign to reduce public exposure of management UIs, they can use the framework to measure the reduction in findings related to this category month-over-month.
- Enhanced Asset Visibility: The emphasis on comprehensive asset discovery, including dynamic assets via CTLs and Passive DNS, highlights a critical defensive gap. Many organizations underestimate their true attack surface. CERTs can advocate for and provide guidance on more robust asset inventory practices, ensuring that "half the findings" (as observed for smaller institutions on dynamic assets) are not missed.
- Cross-Sector and Cross-Border Learning: While the case study focused on academia, the framework is designed to be applied to other sectors (finance, healthcare). This enables CERTs to compare security trends and best practices across different industries or even national boundaries, fostering a broader understanding of effective defensive strategies. The observation of differing national patterns (e.g., Czechia's higher findings relative to its size) can prompt deeper investigations into national policy, awareness, or common technological deployments that impact security.
In essence, Haaga's framework empowers CERTs to act as strategic leaders in cybersecurity, providing them with the intelligence needed to understand, prioritize, and effectively mitigate risks across their entire constituency, ultimately raising the collective security bar.
Key Takeaways
- Benchmarking is Essential but Challenging: Traditional security ratings are insufficient for CERTs; a customized, actionable, and auditable framework is needed to understand and improve sector-wide security posture.
- Context and Classification are Paramount: Effective benchmarking requires classifying organizations by type, size, location, and asset profile. A "size x mission" equation strongly dictates an organization's security footprint, with research universities showing significantly more issues than smaller colleges.
- Distributions Trump Averages: A highly skewed distribution of security issues exists (e.g., 5% of institutions hold 80% of findings). CERTs should focus on identifying and addressing these outliers rather than relying on misleading average metrics.
- Comprehensive Asset Discovery is Crucial: Relying solely on static IP ranges misses a significant portion of issues, especially for smaller organizations. Dynamic asset discovery methods like Certificate Transparency Logs (CTLs) are vital to capture the full attack surface.
- Data Quality and Normalization are Non-Negotiable: Benchmarking data must be global, complete, continuous, and have a low false positive rate. Robust normalization processes are required to ensure data consistency over time, even with variable data source volumes.
- Actionable Insights for Defenders: The framework provides clear guidance for CERTs to prioritize mitigation efforts on prevalent service categories (e.g., remote access, management UIs) and to strategically allocate resources by targeting high-risk outliers within their constituency.
About the Speaker(s)
Juha Haaga is a professional from Arctic Security. He developed the benchmarking framework presented in this talk as a personal "hobby project," working on it in his evenings. His motivation stems from a keen interest in understanding industry-level security trends and addressing the common questions CERTs and their constituents have about comparative security performance. Haaga's experience working with academic institutions over several years provided the initial inspiration and the ideal case study for developing and validating his practical benchmarking methodology.
Reviews
Dr. Zero (Offensive Security Researcher) — STRONG ACCEPT
Haaga built something genuinely useful: a repeatable framework for CERTs to benchmark entire sectors using public and commercial scan data, with honest discussion of the normalization hell that entails. The academic sector case study is well-chosen and the 5%-holds-80% finding gives defenders an actual prioritization lever. Not groundbreaking research, but solid operational craft that most national CERTs should steal.
Heather Calloway (CISO) — STRONG ACCEPT
This is exactly the kind of work CERTs need and rarely get: a practical, replicable framework for understanding where your constituency actually stands. The 5%-accounts-for-80% finding alone justifies the work. I'd hand this to any national CERT director wondering how to prioritize their limited headcount.
→ Top-rated talks at FIRSTCON26 — 38th Annual FIRST Conference