Keynote: The Observability Platform Engineering Advantage: From Zero-Code to M... Kasper Borg Nissen
Kasper Borg Nissen
KubeCon + CloudNativeCon Europe 2025 · Keynote
Overview
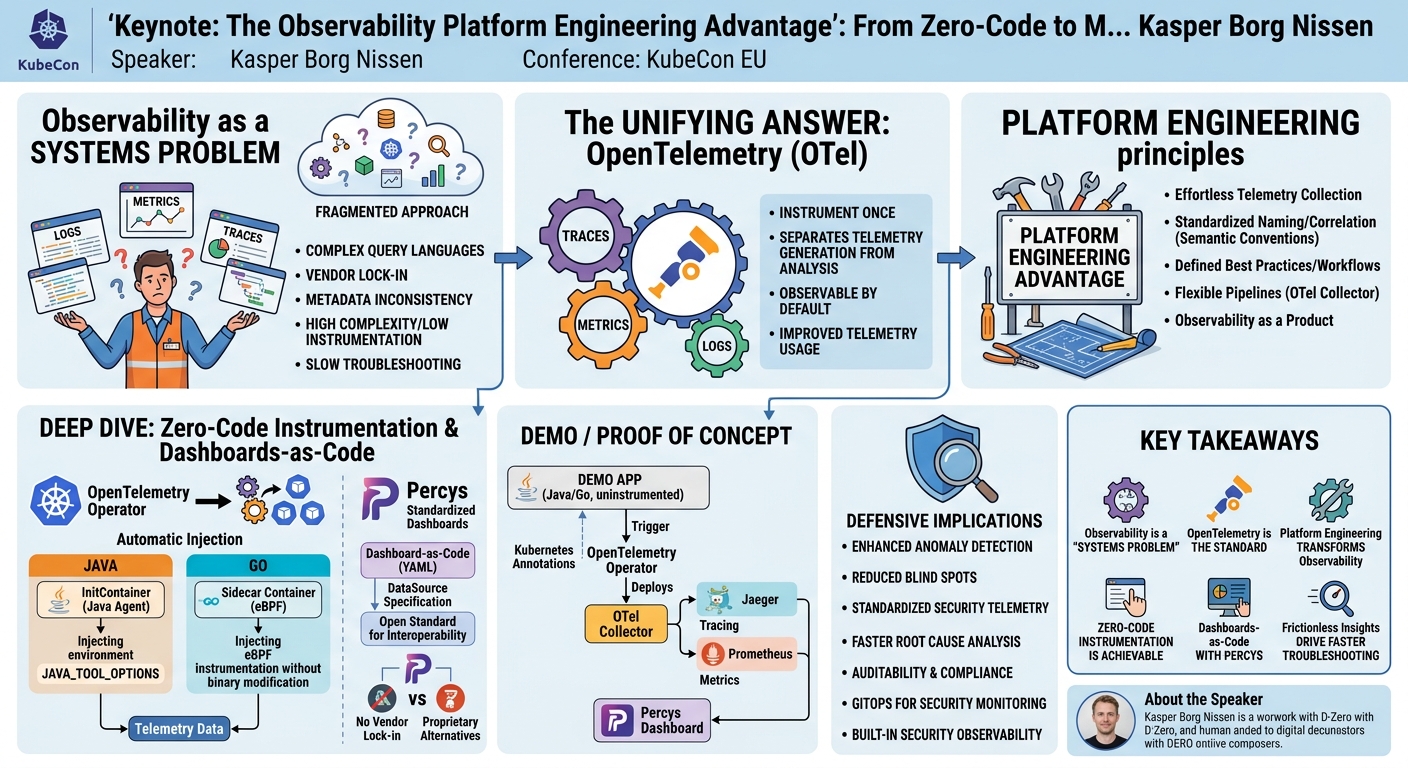
Kasper Borg Nissen, in his final address as co-chair for KubeCon Cloud Native Con, delivered a compelling keynote that reframed the fundamental challenges of modern observability. Moving beyond the traditional "three pillars" of logs, traces, and metrics, Nissen argued that the industry faces a systems problem, not merely a data collection problem. This fragmentation, where engineers juggle multiple browser tabs and manually correlate disparate signals, leads to inefficiency, error-prone troubleshooting, and often relegates observability to an afterthought.
Key moments
- 0:20 The 'systems problem' with fragmented observability
- 1:10 Shift towards OpenTelemetry for standardization and correlation
- 1:50 OpenTelemetry's four key advantages for modern observability
- 2:50 Applying platform engineering to transform observability experience
- 4:05 Zero-code automatic instrumentation using OpenTelemetry Operator
- 4:30 Perses: Open dashboard specification for monitoring as code
- 5:20 Overview of demo setup with OTel, Perses, Jaeger, Prometheus
- 6:55 Showing application code with no custom instrumentation
Keynote: The Observability Platform Engineering Advantage: From Zero-Code to M... Kasper Borg Nissen
Speakers: Kasper Borg Nissen
Conference: KubeCon EU
YouTube: https://www.youtube.com/watch?v=tSBfDzStoYE
Overview
Kasper Borg Nissen, in his final address as co-chair for KubeCon Cloud Native Con, delivered a compelling keynote that reframed the fundamental challenges of modern observability. Moving beyond the traditional "three pillars" of logs, traces, and metrics, Nissen argued that the industry faces a systems problem, not merely a data collection problem. This fragmentation, where engineers juggle multiple browser tabs and manually correlate disparate signals, leads to inefficiency, error-prone troubleshooting, and often relegates observability to an afterthought.
The talk introduced a transformative approach, advocating for the integration of platform engineering principles to build a seamless, scalable, and developer-friendly observability experience. Central to this vision are OpenTelemetry (OTel), the rapidly maturing CNCF project standardizing telemetry collection, and Percy's, an emerging CNCF sandbox project aiming to standardize dashboarding. Nissen demonstrated how these open-source tools, when combined with automated instrumentation via the OpenTelemetry Operator, enable a "zero-code" observability model, significantly reducing friction and empowering developers to gain deep insights into their applications without manual effort.
This presentation is highly significant for any organization grappling with the complexities of distributed systems and the ever-growing volume of operational data. By presenting a clear path towards unified, standardized, and automated observability, Nissen's keynote provides a strategic blueprint for platform teams seeking to enhance developer productivity, accelerate troubleshooting, and ensure the reliability and performance of cloud-native applications. It challenges the status quo, urging a shift from reactive data collection to proactive, built-in observability that treats monitoring as an integral product within the development lifecycle.
Background
▶ Watch: The 'systems problem' with fragmented observability (0:20)
For years, the industry has relied on the "three pillars" of observability: logs, traces, and metrics. While each provides valuable insights, the prevailing challenge has been their fragmented nature. Engineers are often forced to manually correlate data across different tools and browser tabs, a process that is inherently inefficient, prone to human error, and fails to provide a cohesive understanding of complex system behavior. This fragmentation is not merely an inconvenience; it represents a fundamental "systems problem" that hinders effective troubleshooting and overall operational efficiency.
Several specific challenges arise from this fragmented approach:
- Complex Query Languages: Many disparate systems rely on unique and complex query languages, making it difficult to unify insights across platforms.
- Vendor Lock-in: Proprietary vendor plugins and agents restrict flexibility, creating barriers to switching tools and fostering dependence on specific providers.
- Metadata Inconsistency: Inconsistent metadata across different platforms leads to unreliable correlations and a lack of a single source of truth.
- High Complexity, Low Instrumentation: The sheer complexity of implementing observability often deters teams from instrumenting their applications thoroughly, resulting in significant gaps in visibility.
- Slow Troubleshooting: Without unified insights, troubleshooting remains a slow and arduous process, forcing engineers to manually piece together information from various sources.
A significant shift is underway to address these challenges, driven by a community-wide movement towards correlation and standardization, primarily championed by OpenTelemetry (OTel). OpenTelemetry, a Cloud Native Computing Foundation (CNCF) project, has rapidly emerged as the de facto standard for distributed tracing and has since expanded its scope to encompass logs and metrics. It stands as the second-largest project within the CNCF by contributor count, underscoring its broad industry adoption and collaborative development.
OpenTelemetry brings four key advantages that directly combat the aforementioned problems:
- Instrument Once: Developers can instrument their applications once, and that instrumentation works seamlessly across any backend, eliminating proprietary agents and the need for re-instrumentation when switching tools.
- Separates Telemetry Generation from Analysis: OTel ensures that telemetry is produced independently from the tools used to analyze it. This empowers teams to switch observability platforms without re-instrumenting their code, allowing vendors to focus on analytics rather than proprietary data collection.
- Observable by Default: Open-source libraries can now ship with native OpenTelemetry instrumentation, significantly reducing the effort required from application developers to achieve observability.
- Improved Telemetry Usage: By linking signals together (logs, traces, metrics), OpenTelemetry drastically reduces cognitive load during troubleshooting, making the process far more efficient and intuitive.
Building on the foundation of OpenTelemetry, the talk emphasized the critical role of platform engineering. Observability, Nissen argued, isn't just about better data; it's about making that data accessible and actionable. By applying platform engineering principles, organizations can transform observability from an afterthought into a seamless, scalable, and developer-friendly experience. This involves:
- Effortless Telemetry Collection: Observability should be built-in, with OpenTelemetry enabling instrumentation for effortless data collection.
- Standardized Naming and Correlation: OpenTelemetry's vendor-neutral APIs and semantic conventions standardize naming across traces, metrics, and logs, facilitating automatic correlation and reducing inconsistencies.
- Defined Best Practices and Workflows: Platform engineering teams should define and enforce best practices and workflows, making it easy for developers to implement observability correctly.
- Flexible Pipelines: The OpenTelemetry Collector architecture supports flexible pipelines, allowing teams to customize their telemetry processing and routing based on specific needs.
- Observability as a Product: Treating observability as a product, complete with support, documentation, and continuous improvement, ensures its sustained value and adoption within an organization.
By embedding observability directly into developer workflows, platform engineering aims to remove friction, reduce toil, and unlock the true value of comprehensive system visibility.
Key Findings
▶ Watch: OpenTelemetry's four key advantages for modern observability (1:50)
The central premise of the talk is that the prevalent approach to observability, characterized by fragmented tools and manual correlation of logs, traces, and metrics, constitutes a "systems problem" rather than merely a data collection challenge. This fundamental reframing highlights the inefficiencies, errors, and cognitive overhead that plague modern operations teams.
The talk's key findings and contributions outline a comprehensive solution to this problem:
- Observability as a Systems Problem: The core finding is the identification of observability as a holistic system challenge rather than a collection of independent data streams. This perspective underscores the need for unified, correlated insights to effectively understand and troubleshoot complex distributed systems.
- OpenTelemetry as the Unifying Standard: OpenTelemetry is presented as the definitive solution for standardizing telemetry collection across logs, metrics, and traces. Its vendor-neutral APIs, semantic conventions, and ability to eliminate proprietary agents are crucial for fostering cross-signal correlation, reducing metadata fragmentation, and significantly lowering cognitive load during incident response.
- Platform Engineering for Seamless Observability: The talk champions the application of platform engineering principles to transform observability from an afterthought into a "seamless, scalable, and developer-friendly experience." This involves treating observability as a product, defining best practices, and embedding it directly into developer workflows to make it effortlessly accessible.
- Zero-Code, Automated Instrumentation via OpenTelemetry Operator: A significant breakthrough highlighted is the OpenTelemetry Operator, which enables automatic, "zero-code" instrumentation for applications written in popular languages like Go, Node.js, .NET Core, Java, and Ruby. This eliminates the need for developers to manually add instrumentation code, drastically reducing the barrier to entry and ensuring comprehensive visibility by default.
- Standardized Dashboarding with Percy's: To complement standardized data collection, the talk introduces Percy's, a CNCF sandbox project dedicated to providing an open dashboard specification. Percy's enables "dashboards as code," allowing teams to define, version control, and manage their monitoring dashboards using GitOps principles. This eliminates vendor lock-in in visualization and ensures consistency across monitoring views.
- Frictionless Insights and Faster Troubleshooting: The combined power of OpenTelemetry, the OpenTelemetry Operator, and Percy's, orchestrated through a platform engineering approach, culminates in frictionless telemetry collection, automatic cross-signal correlation, and consistent, version-controlled dashboards. This integrated ecosystem empowers developers to gain immediate insights, troubleshoot problems significantly faster, and maintain application reliability with reduced toil.
In essence, the talk demonstrates a viable path to achieving a mature observability posture where data is inherently correlated, collection is automated, and visualization is standardized, thereby addressing the foundational "systems problem" of fragmented monitoring.
Technical Deep Dive
▶ Watch: Zero-code automatic instrumentation using OpenTelemetry Operator (4:05)
The technical heart of the presented solution revolves around three key open-source projects: OpenTelemetry, the OpenTelemetry Operator, and Percy's. These components work in concert to deliver a platform engineering advantage for observability.
OpenTelemetry (OTel)
As a CNCF project, OpenTelemetry has become the de facto standard for collecting telemetry data, encompassing traces, metrics, and logs. Its core technical contributions include:
- Vendor-Neutral APIs and SDKs: OTel provides standardized APIs and SDKs for various programming languages, allowing developers to instrument their applications once without coupling them to a specific observability backend. This fosters true portability and prevents vendor lock-in.
- Semantic Conventions: A critical aspect of OTel is its emphasis on semantic conventions. These are standardized naming conventions and attribute definitions for common operations (e.g., HTTP requests, database calls, RPCs). By adhering to these conventions, OTel ensures that telemetry data is consistently named and structured across different services and languages, enabling automatic correlation and easier interpretation. For instance, an HTTP request will consistently have attributes like
http.method,http.status_code, andhttp.url, regardless of the language or service. - OpenTelemetry Collector: The OpenTelemetry Collector is a powerful and flexible component that can receive, process, and export telemetry data. It acts as an intermediary, allowing for:
- Receivers: Ingesting data from various sources (e.g., OTLP, Jaeger, Prometheus, Zipkin, Fluent Bit).
- Processors: Performing operations like batching, filtering, sampling, adding attributes, or enriching data before export.
- Exporters: Sending data to different backends (e.g., Jaeger, Prometheus, Loki, proprietary vendor solutions, Kafka).
The Collector's architecture supports highly customizable pipelines, enabling platform teams to define exactly how telemetry data flows through their infrastructure. In the demo, two collectors were used: one deployed as a DaemonSet for node-level telemetry (e.g., kubelet stats) and another as a StatefulSet for cluster-wide telemetry, demonstrating its flexibility. The collector configuration explicitly defined pipelines for metrics and traces, receiving data via the OTLP (OpenTelemetry Protocol) and forwarding it to Prometheus and Jaeger, respectively.
OpenTelemetry Operator
The OpenTelemetry Operator is a Kubernetes Operator that simplifies the deployment and management of OpenTelemetry components, most notably enabling automatic instrumentation of applications running within Kubernetes. This is a cornerstone of the "zero-code" observability strategy.
- Custom Resources (CRDs): The operator introduces Custom Resources, such as
Instrumentation, which allow platform engineers to define how applications should be instrumented. This CRD specifies the target collector, sampler configurations, and language-specific injection rules. For example, anInstrumentationresource can specify that Java applications should be auto-instrumented and where their telemetry should be sent. - Language Support: The operator supports automatic instrumentation for a growing list of languages, including Go, Node.js, .NET Core, Java, and Ruby.
- Instrumentation Mechanism:
- Java: For Java applications, the operator injects an OpenTelemetry Java Agent. This is achieved by modifying the pod's deployment to include an
initContainerthat makes the agent available and sets theJAVA_TOOL_OPTIONSenvironment variable to load the agent at JVM startup. This agent then hooks into standard Java libraries and frameworks to capture telemetry without requiring any code changes in the application itself. - Go: For Go applications, the operator utilizes eBPF (extended Berkeley Packet Filter). This is a more advanced technique where the operator injects a sidecar container into the application pod. This sidecar leverages eBPF programs to observe and instrument the Go application's execution at the kernel level, capturing traces and metrics without modifying the Go binary. This approach is particularly powerful for languages that are harder to instrument with traditional agents.
- Opt-in via Annotations: To apply auto-instrumentation, developers or platform teams add specific annotations to their application's pod spec (e.g.,
instrumentation.opentelemetry.io/inject: javaandinstrumentation.opentelemetry.io/instrumentation-name: <namespace>/<instrumentation-resource-name>). This explicit opt-in mechanism provides control over which applications are instrumented.
Percy's
Percy's is a CNCF sandbox project focused on standardizing the definition and management of dashboards. It aims to eliminate vendor lock-in in the visualization layer, much like OpenTelemetry does for data collection.
- Dashboard as Code: Percy's introduces Custom Resources for defining dashboards in YAML. This allows monitoring dashboards to be treated as code, enabling GitOps workflows, version control, and consistent deployment across environments. Teams can define panels, queries (e.g., PromQL for Prometheus), and grid layouts directly in YAML.
- Data Source Specification: Percy's also provides a
Percy's DataSourceCRD, allowing users to define connections to various telemetry backends (e.g., Prometheus, Loki). This separates the dashboard definition from the underlying data source, further enhancing flexibility. - Open Standard: By providing an open specification, Percy's encourages interoperability and ensures that dashboard definitions are not tied to a single vendor's proprietary format. While still in alpha, the project is gaining traction, with many vendors exploring conformity to its standard.
Together, these technologies form a robust platform for modern observability, automating the most challenging aspects of data collection and visualization, and enabling a truly developer-friendly experience.
Demo / Proof of Concept
▶ Watch: Perses: Open dashboard specification for monitoring as code (4:30)
The practical demonstration was a crucial part of the keynote, showcasing the seamless integration of OpenTelemetry, the OpenTelemetry Operator, and Percy's in a live environment. The setup involved a local Kubernetes cluster hosting two distinct applications: a Spring Boot application (Java) utilizing MySQL and a Go application interacting with PostgreSQL.
The initial cluster state revealed several deployed components:
- OpenTelemetry Operator: Responsible for managing OpenTelemetry Collectors and enabling automatic instrumentation.
- OpenTelemetry Collectors: Two instances were running – one as a DaemonSet for node-level telemetry and another as a StatefulSet for broader cluster-wide telemetry. The speaker highlighted a blog post for those interested in the detailed configuration of these collectors.
- The collector configuration was briefly shown, illustrating how it defines pipelines for different signals. For metrics, it was configured to receive data via the OTLP protocol, gather
kubeletstats, and then forward these to Prometheus. For tracing, it also received OTLP data, performed some processing, and then forwarded the traces to Jaeger. - Percy's Operator: Managing the Percy's server for dashboard rendering.
- Jaeger: The distributed tracing system.
- Prometheus: The monitoring system for metrics.
- MySQL and PostgreSQL: The respective databases for the demo applications.
- Two To-Do Applications: The Spring Boot (Java) and Go applications, deliberately written without any custom observability instrumentation.
Zero-Code Instrumentation in Action
The core of the demo focused on demonstrating the "zero-code" instrumentation capability.
- Unmodified Application Code: The speaker first displayed the
RestControllerof the Spring Boot application, explicitly pointing out the complete absence of any custom OpenTelemetry instrumentation or related code. It was a standard Spring Boot application handling basic CRUD operations. - Defining Instrumentation with a CRD: An
InstrumentationCustom Resource Definition (CRD) was applied to the cluster. This CRD, namedinstrumentationand placed in theopen-telemetrynamespace, defined the target OpenTelemetry Collector for telemetry export, specified a sampler configuration, and indicated the desire to include UIDs for Kubernetes resources. - Opting-in via Deployment Annotations: To trigger the automatic instrumentation, specific annotations were added to the deployments of both the Go and Java to-do applications.
- For the Go application, the annotation
instrumentation.opentelemetry.io/inject: gowas added. A crucial additional annotation,instrumentation.opentelemetry.io/go-binary: to-do, was required to specify the binary's location for the eBPF instrumentation to function correctly. - For the Java application, the annotation
instrumentation.opentelemetry.io/inject: javawas added, along withinstrumentation.opentelemetry.io/instrumentation-name: open-telemetry/instrumentation, linking it to the previously definedInstrumentationCRD.
- Operator's Magic: Upon applying these annotations, the OpenTelemetry Operator automatically modified the application pods:
- For the Java application, it injected an
initContainerto provide the OpenTelemetry Java agent and added environment variables, notablyJAVA_TOOL_OPTIONS, to load this agent at JVM startup. - For the Go application, it injected an eBPF sidecar container, which handles the kernel-level instrumentation for Go binaries.
This process demonstrated that developers did not need to touch a single line of application code to enable instrumentation.
Tracing with Jaeger
After the applications were automatically instrumented, the speaker generated some traffic by adding "to-do" items (e.g., "buy OTel swag t-shirt") to both the Java and Go applications.
- Switching to the Jaeger UI, the speaker queried for traces.
- Immediately, traces for both the Go and Java applications appeared, confirming that telemetry was being collected out-of-the-box.
- A deeper dive into a Java application trace showed multiple spans, detailing the entire request flow, including the application's interactions with the MySQL database. Key information like durations and specific function calls were visible, all adhering to OpenTelemetry's semantic conventions, making the traces highly informative and consistent. This visually confirmed the automatic, zero-code collection of distributed traces.
Dashboarding with Percy's
The final part of the demo illustrated dashboards as code using Percy's.
- Percy's DataSource: A
Percy's DataSourceCRD was applied, defining a Prometheus data source. This configuration simply pointed to the Prometheus server running within the local cluster, enabling Percy's to query metrics from it. The speaker noted that Percy's is still in alpha and not yet production-ready, but highlighted its potential. - Percy's Dashboard CRD: A
Percy's DashboardCRD was then applied. This YAML file, although lengthy, defined the dashboard's name, namespace, and, crucially, its various panels. Each panel specified its type (e.g., chart), the Prometheus Query Language (PromQL) query to fetch data, and its layout within a grid system. - Visualizing Metrics: Upon applying the dashboard CRD and refreshing the Percy's server UI, a fully functional dashboard appeared, displaying the configured metrics. This demonstrated how platform teams could manage, version control, and deploy consistent monitoring dashboards using GitOps principles, eliminating vendor-specific dashboard definitions.
The demo successfully highlighted that building a robust observability platform doesn't necessitate complex engineering effort from application developers. Instead, it can be built into the platform, making it accessible and frictionless for every team.
Defensive Implications
▶ Watch: Showing application code with no custom instrumentation (6:55)
While the talk primarily focuses on operational observability and developer experience, the implications for security are profound and often underestimated. Robust, standardized, and automatically collected observability data forms the bedrock of a strong security posture in cloud-native environments.
Here are the key defensive implications derived from Nissen's presentation:
- Enhanced Anomaly Detection and Incident Response: By treating observability as a "systems problem" and unifying logs, traces, and metrics with OpenTelemetry, security teams gain a much clearer, correlated view of system behavior. This allows for faster detection of anomalies that could indicate security incidents, such as unusual network traffic patterns, unauthorized API calls, or unexpected database queries. Cross-signal correlation (e.g., linking an unusual log entry to a specific trace and associated metrics spike) significantly accelerates the investigation and response to security events.
- Reduced Blind Spots and Comprehensive Coverage: The "zero-code" automatic instrumentation enabled by the OpenTelemetry Operator ensures that applications are observable by default. This dramatically reduces the likelihood of critical services or components lacking proper monitoring, which could otherwise become blind spots for attackers. Comprehensive coverage means fewer places for malicious activity to hide.
- Standardized Security Telemetry: OpenTelemetry's semantic conventions are not just for operational metrics; they can and should be extended to security-relevant data. Standardizing how security events, authentication attempts, authorization decisions, and data access patterns are emitted (as logs, spans, or metrics) ensures consistency across the entire application landscape. This consistency is vital for building effective security analytics, threat hunting queries, and security information and event management (SIEM) integrations.
- Faster Root Cause Analysis for Security Incidents: When a security incident occurs, understanding the sequence of events is paramount. Distributed traces, automatically generated by OpenTelemetry, provide a detailed causal chain of requests across microservices. This granular insight can pinpoint the exact service, function, or even database query involved in a breach or vulnerability exploitation, dramatically speeding up root cause analysis and containment efforts.
- Auditability and Compliance: Standardized, immutable telemetry data is critical for meeting compliance requirements and demonstrating auditability. The ability to collect, process, and store tamper-evident logs and traces in a consistent manner, as facilitated by OpenTelemetry and the Collector, strengthens an organization's compliance posture.
- GitOps for Security Monitoring: The concept of "dashboards as code" introduced by Percy's can be directly applied to security monitoring. Security teams can define and version control dashboards that highlight critical security metrics (e.g., failed login attempts, WAF alerts, anomalous API usage). Managing these dashboards via GitOps ensures consistency, auditability of changes, and easy replication across environments, making security monitoring an integral, version-controlled part of the platform.
- Built-in Security Observability: By embedding observability into the platform and treating it as a product, security observability shifts from an afterthought to a built-in capability. This means security concerns are addressed earlier in the development lifecycle, as developers are provided with the tools and standards to emit relevant security signals without additional friction.
In summary, the platform engineering approach to observability, powered by OpenTelemetry and Percy's, provides security teams with a robust, standardized, and automated source of high-fidelity data. This data is essential for proactive threat detection, rapid incident response, comprehensive auditability, and ultimately, building more resilient and secure cloud-native systems.
Key Takeaways
- Observability is a "Systems Problem": The core challenge isn't just collecting logs, metrics, and traces, but the fragmented and inefficient manual correlation across disparate systems. Modern observability demands a unified, holistic approach.
- OpenTelemetry is the De Facto Standard: OpenTelemetry (OTel) is crucial for standardizing telemetry collection. It eliminates vendor lock-in, reduces metadata fragmentation, enables cross-signal correlation, and significantly lowers the cognitive load for engineers.
- Platform Engineering Transforms Observability: By applying platform engineering principles, observability shifts from an afterthought to a seamless, scalable, and developer-friendly experience, with built-in instrumentation and defined best practices.
- Zero-Code Instrumentation is Achievable: The OpenTelemetry Operator automates the instrumentation of applications (Go, Java, Node.js, .NET Core, Ruby) in Kubernetes, injecting agents or sidecars (e.g., eBPF for Go) without requiring any code changes from developers.
- Dashboards as Code with Percy's: Percy's standardizes dashboarding, allowing teams to define, version control, and deploy monitoring dashboards using YAML and GitOps principles, ensuring consistency and eliminating vendor lock-in in visualization.
- Frictionless Insights Drive Faster Troubleshooting: The combination of automated collection, standardized data, and consistent visualization empowers developers with immediate, correlated insights, leading to significantly faster problem identification and resolution.
About the Speaker(s)
Kasper Borg Nissen is a prominent figure in the cloud-native community, known for his deep expertise in observability and platform engineering. His keynote at KubeCon EU marked his final appearance as co-chair for KubeCon Cloud Native Con, signifying his significant contributions and leadership within the CNCF ecosystem. Throughout the talk, he referenced his work and insights from D-Zero, where he appears to be actively involved in advocating for and implementing modern observability solutions. His extensive experience in the field is evident in his comprehensive understanding of the challenges organizations face and his clear vision for leveraging open-source technologies like OpenTelemetry and Percy's to build more efficient and developer-centric platforms.
Reviews
Dr. Zero (Offensive Security Researcher) — MUST SEE
Kasper Borg Nissen's keynote isn't just another observability talk; it's a brutal take on the "systems problem" of fragmented monitoring and a clear strategic blueprint for fixing it. He lays out how OpenTelemetry, combined with the power of the OpenTelemetry Operator's "zero-code" instrumentation (including clever eBPF tricks for Go) and the emerging Percy's for standardized dashboards, delivers a genuinely actionable, platform-engineered solution. This isn't marketing fluff; it's a deep dive into building an observable-by-default environment that cuts through vendor lock-in and cognitive load. This is how you stop chasing logs and actually get real signal.
Heather Calloway (CISO) — STRONG ACCEPT
Nissen's keynote masterfully reframes observability as a critical 'systems problem,' offering a robust platform engineering solution built on OpenTelemetry and Percy's. While not a security-specific talk, its focus on automated, standardized, and correlated telemetry data collection provides the indispensable foundation for effective security governance, rapid incident response, and comprehensive auditability. This isn't just about operational efficiency; it's about building the institutional resilience required to manage complex risks, making it highly relevant for any CISO looking to reduce blind spots and improve accountability.