Canary in the Datamines: Using Log Canary to Find PII
Ryan Slama (Associate Software Engineer, Product Security Foundations · Slack)
LocoMocoSec 2020: Hawaiʻi Product Security Conference (Virtual) · Day 1 · Online
Overview
In "Canary in the Datamines: Using Log Canary to Find PII," Ryan Slama from Slack's Product Security Foundations team addresses a perennial and critical challenge in software development: the inadvertent logging of Personally Identifiable Information (PII) and other sensitive data. Despite significant engineering resources, even tech giants like Facebook and Google have faced high-profile incidents involving plain-text passwords and other confidential information inadvertently making its way into system logs. Slama's talk introduces Log Canary, an innovative, autonomous system developed at Slack to proactively detect such leaks in production environments before they can cause significant harm.
Key moments
- 0:00 Introduction: The pervasive problem of PII in logs
- 4:10 Why preventing sensitive data in logs is hard
- 8:00 Introducing Log Canary: The 'canary string' detection method
- 9:50 Why testing Log Canary in production is critical
- 11:00 Implementation: Log Canary's microservice and Grafana alerts
- 16:00 Handling dynamic sensitive data like login tokens
- 17:50 Alerting, remediation process, and Log Canary's effectiveness
- 20:50 Future work: Achieving full coverage with static taint analysis
Canary in the Datamines: Using Log Canary to Find PII
Speakers: Ryan Slama, Associate Software Engineer, Product Security Foundations, Slack
Conference: LocoMocoSec
YouTube: https://www.youtube.com/watch?v=vb0Hq7fGWYU
Overview
In "Canary in the Datamines: Using Log Canary to Find PII," Ryan Slama from Slack's Product Security Foundations team addresses a perennial and critical challenge in software development: the inadvertent logging of Personally Identifiable Information (PII) and other sensitive data. Despite significant engineering resources, even tech giants like Facebook and Google have faced high-profile incidents involving plain-text passwords and other confidential information inadvertently making its way into system logs. Slama's talk introduces Log Canary, an innovative, autonomous system developed at Slack to proactively detect such leaks in production environments before they can cause significant harm.
The core of the problem lies in the inherent tension between the necessity of comprehensive logging for observability and debugging, and the imperative to protect sensitive customer data. Slack, as a channel-based messaging platform, handles a vast amount of highly sensitive information, from message text to private keys, treating virtually all user-generated data with the highest level of security. Log Canary offers a robust, true-positive detection mechanism by simulating user interactions with deliberately crafted "canary strings," which, if found in logs, immediately signal a security breach.
This talk is crucial for any organization grappling with data privacy and security in complex, rapidly evolving software environments. Slama demonstrates how a strategic investment in automated security tooling can significantly reduce risk, maintain customer trust, and even contribute to broader industry security through upstream contributions. It highlights the importance of moving beyond traditional pre-production testing to continuous, real-time monitoring in production, acknowledging that many logging paths only manifest under real-world, exceptional circumstances.
Background
▶ Watch: Introduction: The pervasive problem of PII in logs (0:00)
The pervasive issue of sensitive data leaking into logs is a recurring nightmare for even the most well-resourced technology companies. As highlighted by Slama, incidents involving plain-text passwords or other PII appearing in logs have impacted major players like Facebook and Google, underscoring the difficulty of preventing such occurrences in large-scale, complex systems. The fundamental conflict arises from the necessity of comprehensive logging for observability, debugging, and incident response in modern, distributed web applications. Without detailed logs, diagnosing issues in multi-component, multi-service architectures becomes nearly impossible.
Slack, as an enterprise-grade communication platform, deals with an extraordinary volume of sensitive data. This includes not only message content and user credentials but extends to internal project details, API tokens, and even seemingly innocuous elements like custom emoji names, which can reveal sensitive information about ongoing projects if leaked. Slack's product security operations are structured into two teams: Product Security Classics, handling traditional responsibilities like feature reviews, bug bounties, and penetration testing, and the Product Security Foundations team, where Slama works. The Foundations team focuses on strategic initiatives, creating secure-by-default libraries and services, automation, and developer education to limit Slack's overall risk surface.
Slack's observability stack is standard yet powerful, leveraging tools such as the ELK stack (Elasticsearch, Logstash, Kibana) for log aggregation and analysis, Prometheus for time-series data, Grafana for visualizations and alerts, and Honeycomb for distributed tracing and per-request profiling. While these tools are essential for operational reliability, they also become potential vectors for data leakage if not managed carefully. The sheer scale of Slack's codebase, comprising millions of lines, combined with a rapid deployment cadence of "many times a day," makes it incredibly challenging to predict what data might inadvertently end up in a log string. Edge cases, unexpected function calls, and the dynamic nature of a constantly changing codebase mean that a logging statement considered safe today might become a vulnerability tomorrow.
Historically, Slack has implemented several layers of defense against sensitive data logging. These include:
- Hackling for strong typing, providing developers with greater confidence and context regarding the data they handle.
- Comprehensive documentation to inform developers about sensitive data and acceptable logging practices.
- Developer education through rigorous standards on what constitutes sensitive data.
- Code reviews, both automated (using tools to detect patterns) and manual, to catch potential logging issues pre-merge.
- Automatic log sanitization scripts as a last line of defense to strip sensitive information before it reaches the logs.
However, as Slama emphasizes, these measures, while valuable, are not foolproof. The talk pivots from these preventative and sanitization methods to a proactive, real-time instrumentation and alerting strategy designed to catch issues in production, limiting their impact significantly.
Key Findings
▶ Watch: Introducing Log Canary: The 'canary string' detection method (8:00)
The central innovation presented in this talk is the Log Canary system, built on a straightforward yet powerful insight: what if we could simulate a user interacting with our systems, deliberately injecting a unique, easily identifiable string into various data paths, and then monitor our logs for its presence? The core findings and contributions of this approach are:
- The Canary String Principle: A canary string is a long, random, and unique string that is intentionally included in requests made to various API endpoints (both public and private). The expectation is that this string should never legitimately appear in production logs. If it does, it immediately indicates that sensitive data has been logged, triggering an alert.
- 100% True Positives: A significant advantage of the canary string approach is its extremely high signal-to-noise ratio. The appearance of a canary string in logs is, by design, a definitive indicator of a problem. This eliminates false positives, building a high degree of confidence in the alerting system and allowing security teams to focus on genuine issues.
- Testing in Production is Paramount: While testing in pre-production environments (like staging) can catch some issues, Log Canary's design emphasizes testing in production. This is a critical finding because:
- Edge Cases: Logging often occurs in "exceptional circumstances" or when things go wrong, not during the "happy path." Pre-production environments, designed for stability and control, often fail to replicate the complex, unpredictable edge cases that manifest only in live production.
- Full Request Path Coverage: Running real API calls against production servers ensures that the entire request path is exercised, from load balancers, Apache, routing, to the database layer. This provides comprehensive coverage that integration tests alone cannot achieve.
- Real-World Impact and Upstream Contributions: Log Canary has already proven its effectiveness. A notable instance involved catching a "massive issue" in Vitess, YouTube's MySQL clustering system used by Slack, Pinterest, Square, and GitHub. This issue only manifested during shard splits in production. Log Canary's detection led to a patch being merged upstream into Vitess, demonstrating the system's impact beyond Slack's internal security.
- Autonomous, Rapid, and Actionable Detection: The system was designed to be completely automatic ("set up and forget"), rapidly detecting issues, and providing actionable notifications. This ensures that security teams are immediately aware of a problem, with sufficient context (links to logs, quantity of data) to begin remediation swiftly.
These findings collectively demonstrate that a well-designed, production-focused canary system can be an indispensable tool for identifying and mitigating sensitive data leaks in complex, dynamic software environments, offering a level of confidence and real-world coverage that traditional testing methods often miss.
Technical Deep Dive
▶ Watch: Implementation: Log Canary's microservice and Grafana alerts (11:00)
The Log Canary system is engineered for automation, rapid detection, and actionable alerts. It consists of two primary components: a headless microservice and a Grafana dashboard, working in tandem with Slack's existing logging and alerting infrastructure.
The Headless Microservice
This microservice is the engine of Log Canary, responsible for generating and executing the canary tests.
- Canary Definition: The service maintains a data structure comprising a list of "canaries." Each canary is an arbitrary block of code designed to call specific API endpoints (both public and private) with embedded canary strings. These strings are long, random, and unique, ensuring they won't naturally occur in logs.
- Execution Cadence: Canaries are executed at configurable, regular intervals. This continuous testing ensures that any new logging paths or changes that introduce vulnerabilities are quickly identified.
- Negative Testing: Crucially, canaries include "bad requests." This is because sensitive data is often logged when things go wrong – e.g., an invalid ID, a violated invariant, or an unexpected error path. By simulating these failure conditions, Log Canary ensures coverage of error-handling and exception-logging code paths.
- Technology Stack: The microservice is built in Go. Ryan Slama highlights several advantages of Go for this project:
- Fast Prototyping: Go allowed for quick development and deployment.
- Ease of Deployment: Integration with Slack's microservice infrastructure was seamless.
- Type System: Go's strong type system reduced errors compared to dynamically typed languages like Python, enhancing code reliability.
- Concurrency: Go's goroutines made it effortless to run many canaries concurrently and non-blocking, ensuring comprehensive and efficient testing without impacting performance.
The Grafana Dashboard
The Grafana dashboard serves as the monitoring and alerting interface for Log Canary.
- Log Querying: It automatically queries Slack's logging infrastructure (Elasticsearch/Logstash) for the presence of the canary strings.
- Visualization: For each unique canary string, there's a dedicated graph in Grafana. This allows for historical tracking and visualization of when a canary string appeared in logs.
- Alerting: Grafana's built-in alerting features are leveraged to send notifications.
- Slack Integration: Alerts are piped directly into a designated Slack channel, aligning with Slack's internal communication workflows.
- Actionable Information: Each alert includes the quantity of detected canary strings and a direct link to a Logstash query. This enables security teams to quickly investigate the source of the leak, determine which PRs were deployed around the incident time, and initiate remediation. Slack threads further facilitate in-line discussion and collaboration for issue resolution.
Handling Dynamic Sensitive Data
A specific challenge arises with sensitive data that cannot be known in advance, such as newly generated API tokens after a user login. For these scenarios, Log Canary employs a more direct approach:
- Login Canary: A specialized canary performs a login with a username and password, then attempts requests using the newly granted token.
- Direct Elasticsearch Query: After the token is generated and requests are made, the microservice directly queries Elasticsearch for recent logs, searching for the dynamically generated token. To maintain security, it uses Elasticsearch's
countfunctionality, ensuring that the sensitive token itself doesn't end up at the Log Canary service, only the count of its occurrences. - Alert Generation: If the token is found, a Slack message is posted with a link to a Logstash query for investigation, similar to static canary string alerts.
Service Metrics and Autonomy
To ensure the reliability and continuous operation of Log Canary itself, the service also tracks its own metrics:
- Canary Runs and Failures: Metrics are collected on the number of canary runs and their failure rates.
- Alerts on Service Health: Alerts are configured to fire if the number of canary runs drops (indicating a potential service crash) or if the failure rate increases (suggesting an issue with the test environment or the canaries themselves).
These self-monitoring capabilities allow Log Canary to run "completely autonomously," providing confidence that the system is always operational and effectively providing coverage.
Integration with Deployment Process
Slack's mature, multi-stage deployment process (staging, dogfood, canary, percentage-based rollout) is critical for managing risk. Log Canary integrates seamlessly into this process. During deployments, "deploy commanders" monitor dashboards for issues. By having Log Canary metrics visible on these dashboards, potential sensitive data leaks can be identified and acted upon immediately, empowering commanders to roll back, cherry-pick fixes, or fix forward, thereby reducing the impact of any new issues introduced by recent code changes.
Demo / Proof of Concept
▶ Watch: Handling dynamic sensitive data like login tokens (16:00)
While the talk does not feature a live, interactive demonstration, the Log Canary system itself serves as a robust, production-deployed proof of concept. Ryan Slama presents the architecture and operational details of a system that is actively running at Slack, continuously monitoring for sensitive data leaks.
The most compelling "proof of concept" is the real-world impact Log Canary has already had. The incident involving Vitess (YouTube's MySQL clustering system) stands out as concrete evidence of the system's efficacy. Log Canary detected a critical issue that only manifested during shard splits in production, a scenario that would likely have been missed by standard testing environments. This detection not only allowed Slack to mitigate the impact internally but also led to a patch being merged upstream into Vitess, benefiting the broader open-source community.
Furthermore, the presentation includes an example of an actual alert message delivered to Slack, demonstrating the actionable nature of the notifications. This includes the quantity of detected logs and a direct link to the relevant Logstash query, showcasing how security teams are immediately provided with the necessary context to investigate and remediate. The system's ongoing operation and its ability to identify issues over its lifespan confirm its status as a successful, living proof of concept rather than a theoretical exercise.
Defensive Implications
▶ Watch: Future work: Achieving full coverage with static taint analysis (20:50)
Log Canary provides critical defensive capabilities for organizations handling sensitive data, shifting the paradigm from reactive incident response to proactive detection and rapid remediation.
Incident Response and Remediation Workflow
When a Log Canary alert fires, Slack's product security team follows a well-defined process:
- Triage: The alerts are routed to a dedicated Slack channel monitored by a rotating on-call security triage team. This ensures immediate attention.
- Investigation: The first step is to investigate the logs linked in the alert to pinpoint exactly where the canary string (and thus, sensitive data) was logged. This helps understand the context and the specific code path involved.
- Validation: A general query is then crafted to confirm if real user data (not just the canary string) is also being logged in the same manner. This differentiates between a test detection and an actual customer data exposure.
- Ticketing and Escalation: Based on the severity and type of sensitive information identified, a Jira ticket is filed with the relevant engineering team owner.
- Severity: Log Canary issues are automatically classified as High or Critical based on internal guidelines. Critical issues mandate a 7-day SLA for resolution, while High issues have a 30-day SLA.
- Incidents: In exceptional circumstances, particularly involving sensitive customer data, the issue is immediately escalated to an incident, triggering rapid, cross-functional remediation efforts.
- Leadership Support: Slack's leadership prioritizes security, with a company-wide objective to close security tickets within their defined SLAs. This organizational commitment is crucial for the effectiveness of Log Canary, ensuring that detected issues receive the necessary resources and attention for timely resolution.
Limitations and Future Directions
While Log Canary is highly effective, it's essential to acknowledge its inherent limitations:
- Coverage: The system's coverage is directly proportional to the code paths exercised by its defined canaries. As Slack's API is "giant" and constantly evolving, achieving 100% coverage through manual canary creation is a "full-time job for an entire team" and practically impossible.
- Proving Absence: Log Canary can definitively prove the existence of a problem (a true positive) but cannot prove the absence of problems. There might be unexercised code paths where sensitive data is logged, remaining undetected.
To address these limitations and strive for complete coverage, Slack is actively exploring static analysis:
- Goal: To automatically scan all code, covering every API endpoint and code path, ideally at PR time or even with in-editor warnings.
- Methodology: They are utilizing taint analysis, which models the codebase as a flow graph.
- Sources: Functions known to return sensitive data are marked as "sources."
- Sinks: Logging functions are marked as "sinks."
- Data Flow Tracking: The analysis tracks the flow of data from sources to sinks. If data originating from a source ends up in a sink, it flags a potential sensitive data leak.
- Challenges and Progress:
- Dynamic Codebase: Slack's codebase is currently dynamic, making static analysis challenging. However, a large restructure project is underway, which is significantly improving its analyzability.
- Proof of Concept: A proof of concept for taint analysis works, detecting example issues with a "very low false positive rate."
- Performance: The current implementation is too compute-intensive and slow for real-time integration (e.g., blocking PRs or in-editor warnings).
- Current Application: It's currently deployed as a continuous integration (CI) job that runs daily scans. The security team manually reviews the findings. While other applications of taint analysis at Slack have yielded valuable findings, none specifically related to log leaks have been discovered yet by this static analysis tool.
The combination of dynamic, production-based Log Canary and the promising future of comprehensive static analysis represents a multi-layered, robust defensive strategy against the persistent threat of sensitive data exposure in logs.
Key Takeaways
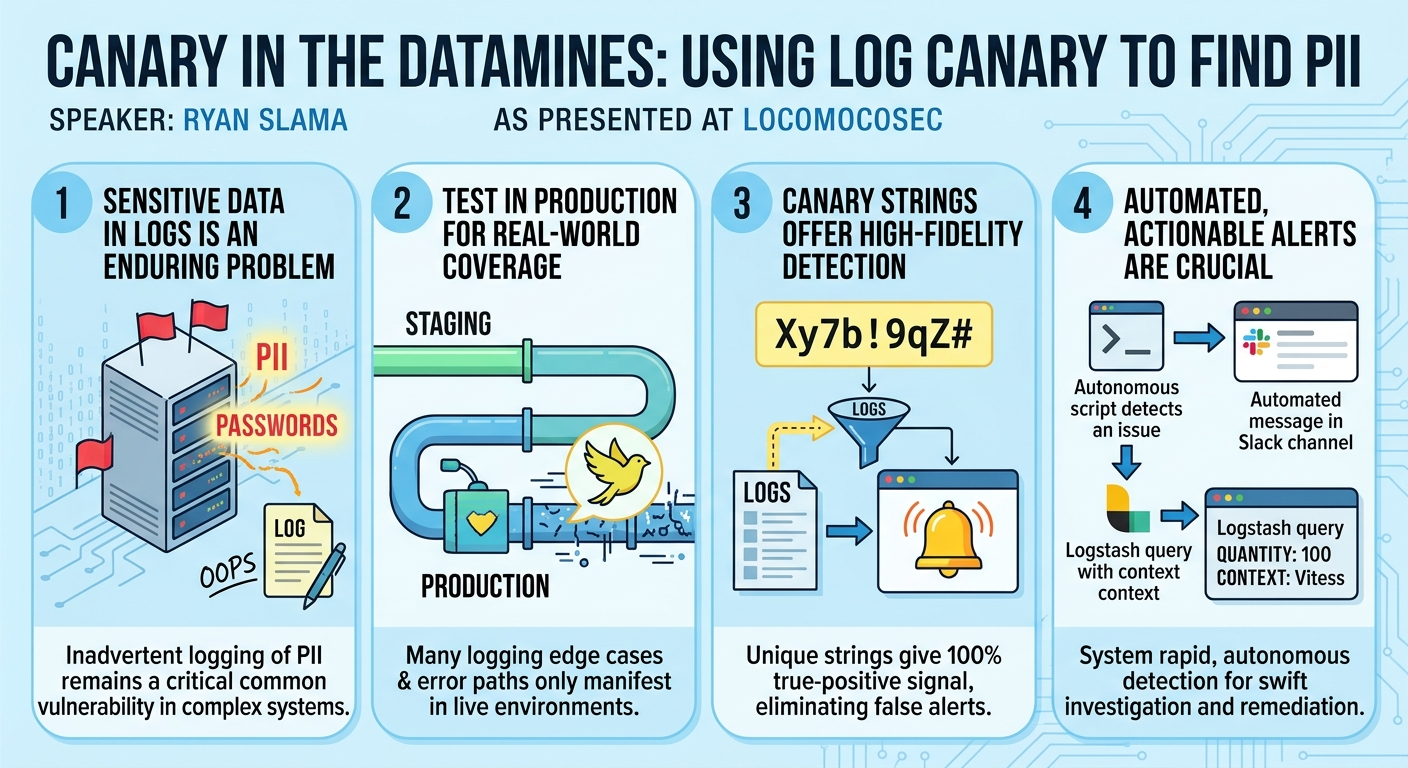
- Sensitive Data in Logs is an Enduring Problem: Despite best efforts and significant resources, inadvertent logging of PII and other sensitive information remains a critical and common vulnerability in complex software systems.
- Test in Production for Real-World Coverage: Many logging paths and edge cases, especially those triggered by errors or unusual circumstances, only manifest in live production environments. Testing in production with systems like Log Canary is essential to catch these elusive issues.
- Canary Strings Offer High-Fidelity Detection: The use of unique, random "canary strings" provides a 100% true-positive detection mechanism. Their presence in logs unequivocally signals a security incident, eliminating false positives and building confidence in the alerting system.
- Automated, Actionable Alerts are Crucial: An effective detection system must be autonomous, provide rapid alerts, and furnish actionable information (e.g., links to logs, context) to enable swift investigation and remediation. Integrating with existing communication and deployment workflows enhances responsiveness.
- Static Analysis is the Future for Comprehensive Coverage: While dynamic testing with canaries is powerful, static analysis (specifically taint analysis) holds the promise of achieving complete code path coverage. It can proactively identify potential data flows from sensitive sources to logging sinks, ideally at the earliest stages of development.
- Organizational Commitment to Security is Paramount: The success of security initiatives like Log Canary relies heavily on strong leadership support, clear security objectives, and defined SLAs for issue resolution, ensuring that security findings are prioritized and acted upon.
About the Speaker(s)
Ryan Slama is an Associate Software Engineer on the Product Security Foundations team at Slack. His work focuses on making strategic bets to limit Slack's overall risk surface. This involves creating secure-by-default libraries and services, leveraging automation to enhance security, and educating developers on secure coding practices. His team's mission is to build foundational security capabilities that empower engineers to develop securely by default, proactively addressing security challenges rather than reacting to them.
Reviews
Dr. Zero (Offensive Security Researcher) — SOLID
Competent internal tooling talk that does exactly what it says on the tin. Log Canary is a sensible, well-executed solution to a real problem, but there's nothing here that a decent security engineer couldn't have designed in an afternoon. It's a good conference filler for folks who haven't thought about this problem yet.
Heather Calloway (CISO) — SOLID
A clean, well-executed practitioner talk on detecting PII in logs using production canary strings. Useful for any shop with a complex logging stack and a real data-handling problem, but the scope is narrow and the technique is not novel — this is solid engineering, not a strategic shift.
→ Top-rated talks at LocoMocoSec 2020: Hawaiʻi Product Security Conference (Virtual)
All talks from LocoMocoSec 2020: Hawaiʻi Product Security Conference (Virtual)