Lyft Cartography: Using Graphs to Improve and Scale Security Decision-Making
Alex Chantavy (Software Engineer, Security · Lyft)
LocoMocoSec 2020: Hawaiʻi Product Security Conference (Virtual) · Day 2 · Online
Overview
In today's rapidly evolving technological landscape, security teams face an uphill battle against ever-increasing complexity and speed. Modern cloud infrastructures, characterized by hyper-growth and intricate permission models, lead to significant security and technical debt. Traditional approaches, often relying on disparate lists and siloed data, struggle to provide a comprehensive understanding of an organization's attack surface and potential risks. This foundational challenge forms the premise of Alex Chantavy's talk, "Lyft Cartography: Using Graphs to Improve and Scale Security Decision-Making."
Key moments
- 0:00 Introduction and the core security problems
- 4:40 Attackers think graphs, defenders think lists
- 7:00 Cartography: open-source security graph architecture
- 8:00 Incident response: quickly identifying affected services
- 10:40 Analyzing cross-account and transitive trust boundaries
- 16:00 Modeling and analyzing AWS IAM permissions effectively
- 21:00 Future roadmap: automated actions and "robot army"
- 32:00 Measuring Cartography's impact and value to security teams
Lyft Cartography: Using Graphs to Improve and Scale Security Decision-Making
Speakers: Alex Chantavy, Software Engineer, Security, Lyft
Conference: LocoMocoSec
YouTube: https://www.youtube.com/watch?v=_fVi3J_0wII
Overview
In today's rapidly evolving technological landscape, security teams face an uphill battle against ever-increasing complexity and speed. Modern cloud infrastructures, characterized by hyper-growth and intricate permission models, lead to significant security and technical debt. Traditional approaches, often relying on disparate lists and siloed data, struggle to provide a comprehensive understanding of an organization's attack surface and potential risks. This foundational challenge forms the premise of Alex Chantavy's talk, "Lyft Cartography: Using Graphs to Improve and Scale Security Decision-Making."
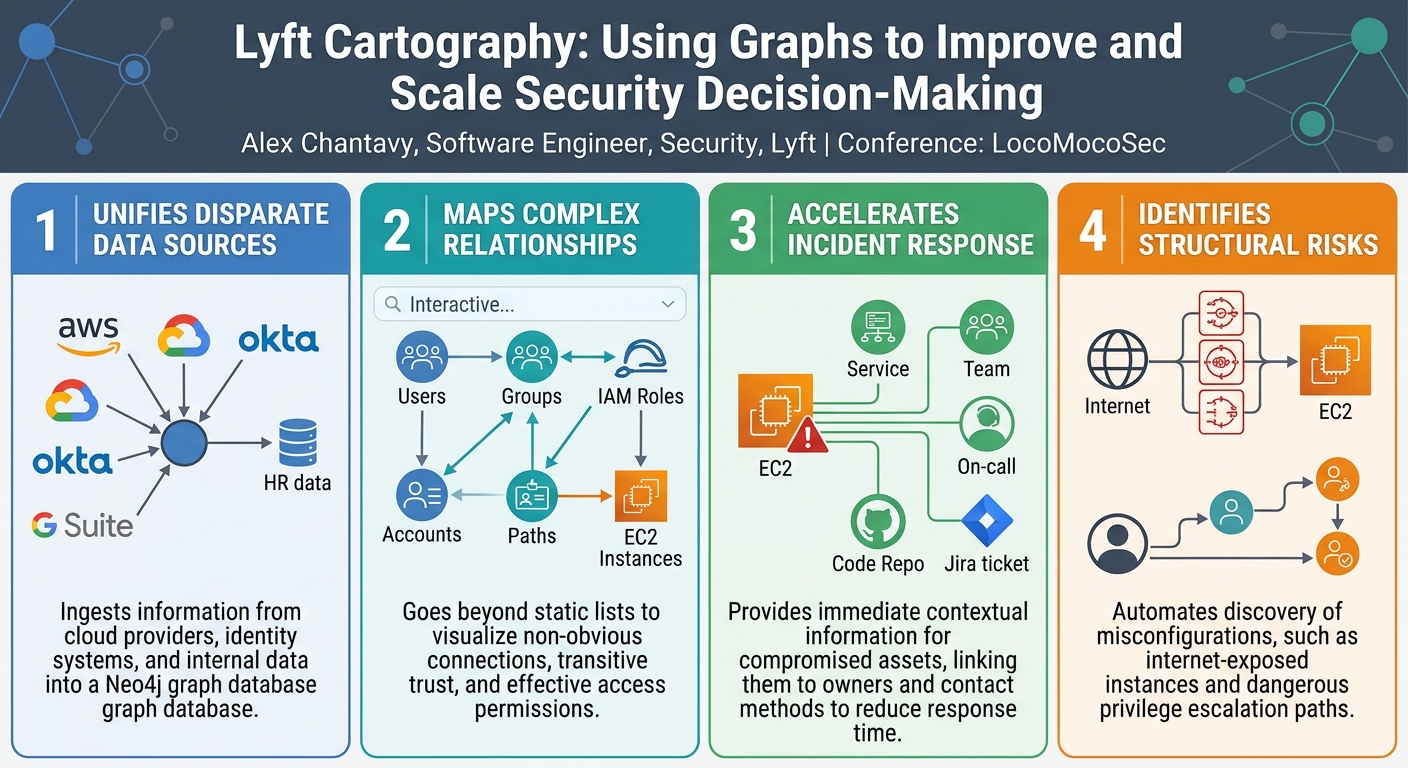
Chantavy, a Software Engineer on the Security team at Lyft, introduces Cartography, an open-source security graph tool designed to address these problems. Cartography pulls data from various sources, including major cloud providers like AWS and Google Cloud Platform, as well as identity providers and internal HR systems, then synthesizes this information into a unified Neo4j graph database. This graph-based approach allows security teams to visualize and analyze relationships between assets, identities, and access policies in ways that traditional list-based methods cannot, thereby improving decision-making and enabling security at scale.
The talk highlights how Cartography provides a self-maintaining map of an organization's infrastructure, revealing non-obvious connections and structural risks. From accelerating incident response to proactively identifying privilege escalation paths and automating vulnerability management, Cartography demonstrates the power of graph theory in transforming defensive security operations. Chantavy emphasizes the tool's extensibility and the community-driven effort to continually enhance its capabilities, making it a vital asset for any security team navigating the complexities of modern cloud environments.
Background
▶ Watch: Introduction and the core security problems (0:00)
The genesis of Cartography at Lyft stemmed from a common pain point experienced by security teams across industries: the relentless pace of development. As companies embrace hyper-growth, the pressure to ship features quickly often leads to the accumulation of security and technical debt. Documentation lags, critical knowledge becomes tribal, and the attack surface expands rapidly. This environment makes it exceedingly difficult to "understand, track, and better manage our infra as it changes over time."
Modern infrastructure further complicates matters. With multiple cloud vendors, diverse configuration options, and intricate permissions models, answering fundamental questions like "who has access to what, under what conditions?" becomes a Herculean task. Authenticating users, managing multi-factor authentication (MFA), and understanding transitive risks – where one identity can assume another, potentially across trust boundaries – are non-straightforward challenges. The consequences of misconfigurations are severe, yet security teams often operate with limited time and resources.
The inspiration for Cartography came from a colleague, Sasha Fa, who proposed applying an offensive security approach to "keep the lights on" problems. This aligns with the influential quote by John Lambert at Microsoft: "Defenders thinking lists, attackers thinking graphs. As long as this is true, attackers win." Chantavy elaborates that while traditional Active Directory environments might offer a single source of truth, cloud environments lack this centralization, making the "attackers think graphs" paradigm even more pertinent. An attacker compromising a low-value asset can pivot through a zigzagging path of interconnected resources to reach a high-value target, a path often invisible to list-based defenders. Existing security solutions evaluated by Lyft were either cost-prohibitive or lacked the necessary extensibility to be augmented with Lyft's unique internal context and data. This gap necessitated a custom, open-source solution that could provide a self-maintaining map of their infrastructure, highlight structural risks, and answer complex security questions by visualizing non-obvious connections between assets and identities.
Key Findings
▶ Watch: Cartography: open-source security graph architecture (7:00)
Cartography emerges as a powerful open-source Python tool designed to unify disparate security data sources into a cohesive, actionable view. Its core contribution lies in its ability to ingest data from a multitude of providers—including AWS, Google Cloud Platform, Octa (identity provider), G Suite, and internal HR data—and represent all these relationships within a Neo4j graph database. This graph-based representation is Cartography's central innovation, enabling security teams to move beyond static lists and understand the dynamic, interconnected nature of their infrastructure.
One of Cartography's primary findings is its efficacy in incident response. Chantavy illustrates a scenario where a compute instance is found running malware. With an organization modeled in Cartography, responders can rapidly identify:
- The service the instance belongs to.
- The on-call personnel for that service and their contact methods (e.g., Slack channel).
- The team responsible for the service.
- The code running on the instance.
- The associated Jira queue for post-incident actions.
This rapid correlation significantly reduces Mean Time To Respond (MTTR) by providing immediate context.
Beyond incident response, Cartography excels at auditing access and identifying cross-trust boundary opportunities. A compelling example involves an Octa user belonging to a "Developers" group, which is allowed to assume an AWS "developers" role in a "dev" account. While this is an intended design, the complexity arises when that "developers" role can then assume an "Auditors" role in a separate "finance" account. Manually uncovering such transitive privilege escalations through AWS consoles or CLI commands is cumbersome. Cartography, by modeling these relationships, immediately highlights such potential risks, allowing security teams to make informed decisions about whether such cross-account access is permissible or constitutes an unacceptable risk. This capability underscores Cartography's ability to provide critical visibility into identity and access management (IAM) challenges that are otherwise obscured in complex cloud environments.
Technical Deep Dive
▶ Watch: Analyzing cross-account and transitive trust boundaries (10:40)
Cartography's architecture is designed for simplicity, extensibility, and data freshness. The core process begins with a command-line sync operation. This triggers one or more Intel modules, which are essentially plugins responsible for pulling data from various sources (e.g., AWS, GCP, Octa, G Suite, HR systems). Once the data is extracted, it is written into the Neo4j graph database, which provides a web browser endpoint for visualization and a Bolt endpoint for programmatic access. After data ingestion, a cleanup job runs to ensure the graph contains only the most up-to-date data, removing any stale or deprecated assets. A crucial step is data enrichment, where intelligence is added to the ingested data through graph queries, flagging specific conditions or relationships.
Lyft's organizational model within Cartography is comprehensive. It links human resources data (e.g., reporting structures, teams from Workday or similar) to identity provider data (Octa identities, groups, and organizations). These identities are then tied to AWS roles and AWS accounts, reflecting how individuals assume roles to access cloud resources across different departmental or billing units. Furthermore, G Suite identities are integrated, allowing for analysis of installed Chrome extensions on employee laptops, identifying potential attack surfaces based on requested permissions. This extensible, pluggable platform allows organizations to combine Cartography's existing modules with their own context, making the graph exponentially more powerful.
A prime example of Cartography's data enrichment capabilities is detecting internet-exposed EC2 instances. The graph models an EC2 instance connected to a network interface, which belongs to an EC2 Security Group. This security group has rules that may be associated with IP ranges, including 0.0.0.0/0 (representing the open internet). Cartography runs a specific Cypher query (Neo4j's intuitive graph query language) to "draw a path from the internet to an IP Rule and see what security groups match that sort of rule." It then identifies network interfaces associated with those security groups and, finally, the EC2 instances they roll up to. If such a path exists, a flag exposed_internet=true is set on the EC2 instance node, allowing for simple, high-level queries later without needing to re-run complex pathing logic.
Another significant technical contribution is Cartography's approach to IAM permissions analysis. The challenge is to determine "what identities can access what resources, and what actions can they perform on these assets?" AWS IAM permissions are structured around principles, policies, and statements (e.g., S3 get object, allow/deny). Cartography performs offline computation to evaluate these statements and the relationships between nodes. If a principle's policy statements allow, for example, S3 get object access to a specific S3 bucket, Cartography derives and establishes a direct relationship in the graph: "Principle can read from S3 bucket." This logic is extensible to other actions like writing to S3, querying DynamoDB, or terminating EC2 instances, providing a clear, visual representation of effective permissions. Lyft recently published a blog post, "I am whatever you say I am," detailing this innovative approach. While Cypher is powerful for developers, Cartography also supports translating graph queries into more familiar formats, such as PostgreSQL tables, enabling integration with tools like SuperSet for generating dashboards and reports for a broader audience.
Demo / Proof of Concept
▶ Watch: Modeling and analyzing AWS IAM permissions effectively (16:00)
While Alex Chantavy's presentation doesn't include a live, interactive demo, he thoroughly describes and showcases the practical deployment and capabilities of Cartography through real-life examples and the work of co-maintainers. The talk effectively functions as a proof of concept by detailing how Lyft leverages the tool in its security operations.
A key aspect of Cartography's real-life deployment, championed by co-maintainer Marco Lanini, focuses on making the powerful graph data accessible to various stakeholders. Recognizing that not all end-users will be proficient in the Cypher query language, Lanini has demonstrated the use of Jupyter notebooks. These notebooks allow security teams to pre-package and run specific reports, presenting the results in an easily consumable format without requiring users to write complex graph queries. This democratizes access to critical security insights.
Furthermore, Cartography's data can be surfaced in tools like Elasticsearch and visualized through Kibana dashboards. This integration enables managers to track changes over time in the infrastructure, monitor key security metrics, and gain executive-level visibility into the organization's security posture. These dashboards can track various reports, with Cartography serving as the foundational data source for all of them. Marco Lanini's blog posts, such as "Mapping and tracking moving clouds," provide further details on these deployment strategies.
Perhaps one of the most compelling features demonstrated is Drift Detection. This capability allows Cartography to monitor how the graph (and thus the underlying infrastructure) changes over time. When specific, critical changes are detected, Cartography can trigger alerts. For instance, if a brand new EC2 instance becomes exposed to the internet or a new IAM admin is identified in the graph, an alert can be sent to platforms like Slack. This proactive alerting mechanism enables security teams to quickly investigate and respond to significant shifts in their security posture, turning dynamic infrastructure changes into actionable intelligence.
Defensive Implications
▶ Watch: Measuring Cartography's impact and value to security teams (32:00)
Cartography offers profound defensive implications, transforming security operations from reactive firefighting to proactive risk management and automated remediation.
- Proactive Risk Identification: By modeling the entire infrastructure as a graph, Cartography uncovers non-obvious connections and transitive trust relationships that are often missed by traditional tools. This includes identifying privilege escalation paths across accounts (e.g., a developer role assuming an auditor role in a finance account) or exposing assets to the internet via complex network configurations. Defenders can now "think like attackers" by visualizing potential attack paths, enabling them to remediate vulnerabilities before they are exploited.
- Accelerated Incident Response: As demonstrated in the talk, when an incident occurs (e.g., malware on an EC2 instance), Cartography provides immediate context. It can quickly link a compromised asset to its owning service, the responsible team, on-call personnel, associated code repositories, and even the appropriate Jira queue. This dramatically reduces the time spent on manual investigation and coordination, allowing for faster containment and resolution.
- Enhanced Vulnerability Management: Cartography extends its reach into the software supply chain. By integrating Amazon Elastic Container Repository (ECR) image scan results, it can ingest information about CVEs and vulnerabilities affecting Linux packages within container images. The true power lies in its ability to then correlate these vulnerabilities with the services and teams that own those images. This enables the automated creation of richly contextualized Jira tickets, assigned to the correct team and including all necessary details (service, image, CVE, team's Jira queue). This addresses the common problem of "security noise" by providing actionable, targeted remediation tasks, moving beyond mere vulnerability tracking.
- Improved Compliance and Auditing: Answering complex audit questions about who has access to what, or verifying specific security controls, becomes significantly easier with Cartography. The graph provides a single source of truth and allows for rapid querying of access policies and relationships, streamlining compliance reporting and reducing manual effort.
- Foundation for Automated Remediation: Chantavy outlines a long-term vision where Cartography serves as the "map" for a "robot army" in the infrastructure. By understanding the state of the environment and the relationships between assets, an orchestrator could use the graph to automatically identify and remediate security problems. This could include automated policy enforcement, patching, or even automated penetration testing, moving towards a truly self-healing and resilient infrastructure. The ultimate goal is to shift from merely tracking security debt to actively fixing it through intelligent automation.
Key Takeaways
- Graph Databases for Cloud Security: Neo4j, combined with a graph-based approach, is an incredibly powerful paradigm for unifying and analyzing complex, disparate data from modern cloud infrastructures, identity providers, and internal systems.
- Cartography as an Extensible Platform: Lyft's open-source Cartography provides a flexible, pluggable platform that allows organizations to ingest data from various sources (AWS, GCP, Octa, HR) and augment it with their unique context, creating a comprehensive, self-maintaining map of their attack surface.
- Automated Risk Identification: Cartography's data enrichment capabilities enable the automated discovery of hidden risks, such as internet-exposed EC2 instances, transitive privilege escalation paths across cloud accounts, and effective IAM permissions, which are often obscured in traditional list-based views.
- Proactive Drift Detection: The tool's drift detection feature provides continuous monitoring of the infrastructure graph, alerting security teams to critical changes like newly exposed assets or administrative privilege grants, facilitating proactive investigation and response.
- Enhanced Incident Response and Compliance: By providing immediate, contextualized information about compromised assets, their owners, and associated processes, Cartography significantly accelerates incident response. It also streamlines compliance and audit reporting by offering a unified, queryable view of access and resource relationships.
- Pathway to Automated Remediation: Cartography lays the groundwork for future automated security actions, including context-rich Jira ticket creation for vulnerabilities and the long-term vision of a "robot army" that uses the graph to intelligently identify and remediate security issues.
About the Speaker(s)
Alex Chantavy is a Software Engineer on the Security team at Lyft. His professional background is rooted in deep security expertise, having previously worked at the National Security Agency (NSA) and Microsoft. In these roles, he developed a strong foundation in red teaming cloud environments, which directly informs his work on Cartography and his understanding of attacker methodologies. Alex is a self-described "Hawaii boy" from Makakilo on the west side of Oahu, and despite now living in Seattle, his homesickness for the islands is a recurring theme in his presentation. He began his programming journey at Iolani, a private school in Hawaii, and brings a unique perspective to solving complex security challenges. Alex is one of the key contributors and advocates for the Cartography project, actively engaging with the open-source community for feedback and contributions.
Reviews
Dr. Zero (Offensive Security Researcher) — SOLID
A competent introduction to Cartography that explains the 'what' and 'why' of graph-based asset inventory well, but doesn't push past the basics. Good for someone who's never thought about graph databases for security; won't teach much to anyone who's already running Neo4j or similar tooling.
Heather Calloway (CISO) — SOLID
Solid defender tooling talk that demonstrates real operational value from graph-based asset inventory. The use cases are practical—incident response context, transitive privilege mapping, drift detection—but this is table-stakes infrastructure for mature cloud programs, not novel methodology. Worth your platform security team's time if they're still reconciling spreadsheets.
→ Top-rated talks at LocoMocoSec 2020: Hawaiʻi Product Security Conference (Virtual)
All talks from LocoMocoSec 2020: Hawaiʻi Product Security Conference (Virtual)