Breaking Obfuscated .NET Malware with Profiler-Based Dynamic Binary Instrumentation
Lars Wallenborn (CrowdStrike), Steffen Haas, Tillmann Werner (CrowdStrike), Lindsay Kaye (VP Threat Intelligence · HUMAN Security)
REcon 2025 · Day 3 · Main Track · Reverse Engineering
Overview
.NET malware is increasingly obfuscated with commodity protectors that embed runtime integrity checks—checks that detect and defeat the standard analyst trick of calling string decryption functions di
Key moments
- 3:04 Initial analysis: identifying obfuscated string decryption routine
- 19:41 JIT callback: hooking CLR JIT compilation events
- 28:17 Profiler injection: injecting the tracing reference at load time
- 36:57 In-flight patching: transparently deobfuscating IL bytecode
- 44:51 Demo reference: live deobfuscation of obfuscated .NET malware
- 52:15 Result: C2 address and network IOCs recovered from obfuscated malware
- 57:08 Conclusion: generic deobfuscation working across .NET protectors
Breaking Obfuscated .NET Malware with Profiler-Based Dynamic Binary Instrumentation
Speakers: Lars Wallenborn, CrowdStrike; Steffen Haas; Tillmann Werner, CrowdStrike; Lindsay Kaye, VP Threat Intelligence, HUMAN Security
Conference: REcon 2025
YouTube: https://www.youtube.com/watch?v=jPDJ_Zo6jiY
Overview
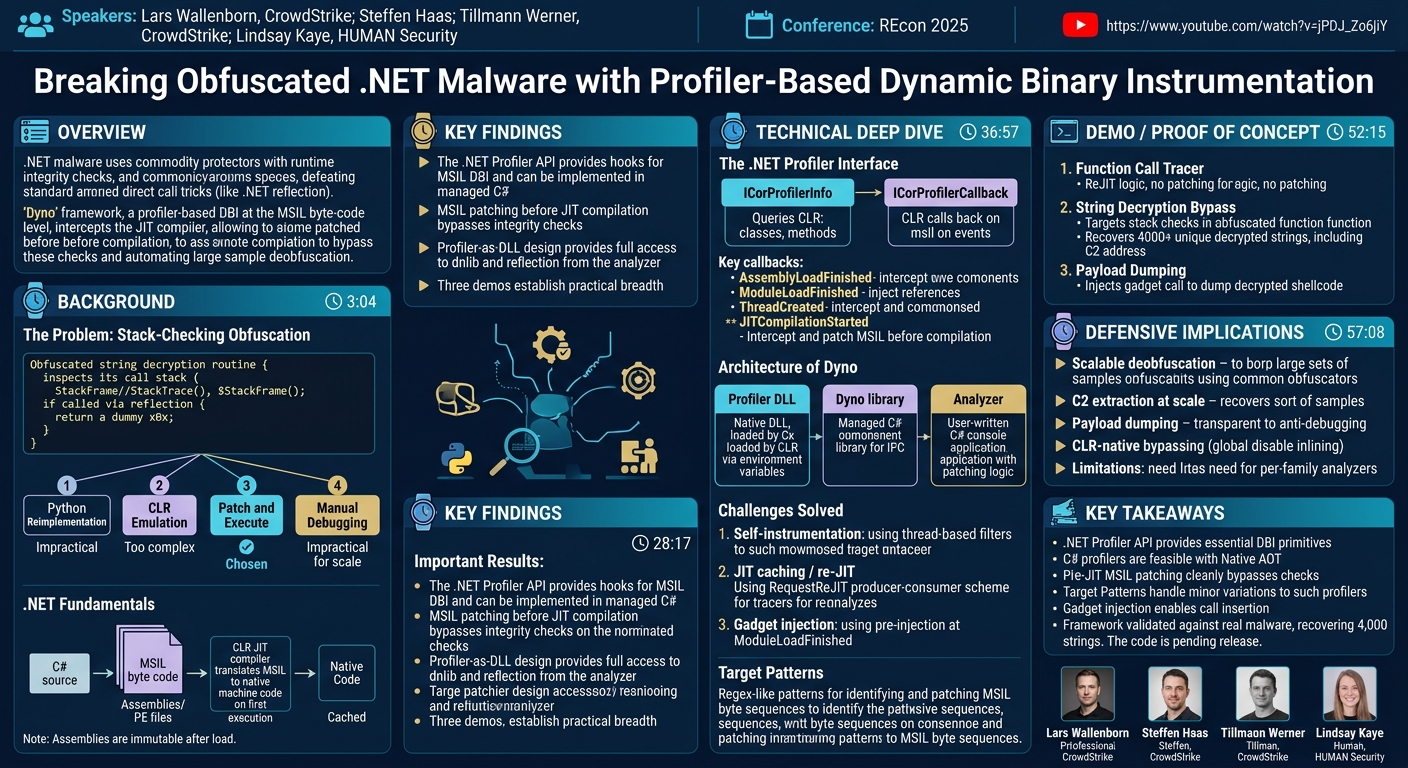
.NET malware is increasingly obfuscated with commodity protectors that embed runtime integrity checks—checks that detect and defeat the standard analyst trick of calling string decryption functions directly via .NET reflection. In this REcon 2025 talk, four researchers from CrowdStrike and HUMAN Security present Dyno, a framework for profiler-based Dynamic Binary Instrumentation at the MSIL (Microsoft Intermediate Language) byte-code level. Dyno intercepts the .NET JIT compiler, allows arbitrary patching of MSIL before compilation, and solves the runtime integrity check problem at its root—enabling automated deobfuscation of large sample sets that would otherwise require painstaking per-sample manual work.
Background
▶ Watch: Initial analysis: identifying obfuscated string decryption routine (3:04)
The Problem: Stack-Checking Obfuscation
The project originated when the team encountered a .NET sample obfuscated with a commodity obfuscator. The goal was simple: extract the C2 server address, which was stored as an encrypted string. Opening the sample in dnSpy revealed a string decryption function using mixed boolean arithmetic and control flow flattening—complex enough that reimplementing it in Python for each of hundreds of samples was not feasible.
The natural shortcut—using .NET reflection to invoke the string decryption function directly—failed. Regardless of what argument was passed, the function returned the string x0x. Digging 100 lines deeper into the function revealed why: a hardcoded x0x string was returned as an error case triggered by a stack check. The function inspected its own call stack using StackFrame/StackTrace and checked the type of its caller. When called via reflection, the caller type is RuntimeMethodHandle—not what the obfuscator expects—so the check fails and the function returns the error value.
Possible approaches considered:
- Reverse-engineer and reimplement the decryption in Python.
- Emulate the .NET runtime and fake the expected stack frame.
- Patch the stack check out of the binary and execute.
- Use a debugger to manually force the correct control-flow path.
Given hundreds of similar samples, options 1 and 4 were ruled out immediately. The team chose option 3—patch and execute—and designed a framework to automate it.
.NET Fundamentals
The .NET execution model involves multiple compilation stages:
- C# / F# / VB.NET source code is compiled to MSIL byte code.
- MSIL byte code lives inside assemblies (PE files containing managed code).
- When an assembly is loaded by the .NET Common Language Runtime (CLR), the CLR's JIT compiler translates each method's MSIL to native machine code on first execution.
- The result is cached to avoid recompilation on subsequent calls.
.NET Core (open-sourced by Microsoft in 2016; currently at version 9, with version 10 expected November 2025) is the target platform for Dyno. The CLR is native code; the JIT is a core CLR component that provides platform independence—each hardware target needs only a different JIT.
A key property for instrumentation purposes: once an assembly is loaded by the CLR, it becomes immutable. Code cannot change after load. This contrasts sharply with native code instrumentation (where self-modifying code and code-as-data are routine concerns) and allows instrumentation to operate at the method level rather than the instruction level—a significantly simpler problem.
Key Findings
▶ Watch: Profiler injection: injecting the tracing reference at load time (28:17)
The research produced several important results:
- The .NET Profiler API exposes all the hooks necessary to implement DBI at the MSIL level, and it can largely be implemented in managed C#—not C++.
- MSIL patching before JIT compilation cleanly bypasses runtime integrity checks because the check never executes; the JIT sees only the patched code.
- The profiler-as-DLL design allows full access to dnlib and the full .NET reflection API from within the instrumentation analyzer, making assembly inspection, string constant extraction, and call-site enumeration trivial.
- Three demos spanning function tracing, string decryption bypass, and payload dumping establish the framework's practical breadth.
- The framework, called Dyno, is pending public release (stuck in an internal review process at time of presentation; the team offered direct access on request).
Technical Deep Dive
▶ Watch: In-flight patching: transparently deobfuscating IL bytecode (36:57)
The .NET Profiler Interface
The .NET CLR exposes a rich profiling interface intended for performance profilers and debuggers. This interface is the foundation of Dyno. It has two groups of APIs:
- ICorProfilerInfo: Allows the profiler to query the CLR—enumerating classes, methods, modules, and assemblies in a loaded assembly.
- ICorProfilerCallback: Allows the CLR to call back into the profiler when events occur. Key callbacks:
AssemblyLoadFinished: Fires when an assembly finishes loading.ModuleLoadFinished: Fires when a module (file) finishes loading—the right moment to inject references before the assembly becomes immutable.ThreadCreated: Fires when a new thread is created—important for malware that spawns additional threads.JITCompilationStarted: The most important callback. Fires before each method is JIT-compiled, providing the opportunity to inspect or replace the MSIL byte code before it is translated to native code.
The SetILFunctionBody method, available from the ICorProfilerInfo interface, allows the profiler to substitute a different MSIL buffer for the one the JIT would have compiled—the core primitive for code patching.
SetEnterLeaveFunctionHooks installs stubs that execute immediately before a method is entered or before it returns, enabling argument and return value inspection without requiring MSIL modification.
Architecture of Dyno
Dyno consists of three components:
- Profiler DLL (
dyno.dll): A native DLL compiled with .NET's AOT (Ahead-of-Time) compilation target (dotnet publishwith Native AOT). Loaded by the CLR via theCORECLR_PROFILER_PATHenvironment variable. Implements theICorProfilerCallbackinterface and communicates with the Analyzer over an in-process IPC mechanism.
- Dyno library: A managed C# library that abstracts the IPC between the Profiler DLL and the Analyzer. Runs entirely in the .NET context.
- Analyzer: The user-written component. A C# console application that references the Dyno library, loads the target assembly, configures instrumentation callbacks, and implements the actual patching logic. Compiled with
dotnet publish. The Analyzer is what changes between use cases—the Profiler DLL and Dyno library are shipped as pre-built binaries.
Execution model: The Analyzer sets the CORECLR_PROFILER and CORECLR_PROFILER_PATH environment variables to point to the Profiler DLL, then launches the target as a subprocess or loads it directly. The CLR automatically loads the Profiler DLL on startup.
A minimal Analyzer that instruments a target looks like:
The JITInterceptor callback receives the method's metadata (thread ID, module base address, method ID), the raw MSIL byte array, a reJIT flag, and a byteCodeModified flag. The analyst modifies the byte array to patch instructions and sets byteCodeModified = true.
Challenges Solved
Challenge 1: Self-instrumentation. Since the Dyno library and Analyzer run in the same process as the target, every method in Dyno would also trigger JITCompilationStarted callbacks. To prevent infinite recursion and noise, the team adopted a thread-based filter: Dyno-related threads are tracked by ID, and JITCompilationStarted callbacks originating from those threads are silently skipped.
Challenge 2: JIT caching / re-JIT. By default, after a method is JIT-compiled and cached, subsequent calls execute the cached native code and never trigger JITCompilationStarted again. For a function call tracer that needs to see every invocation, the team implemented a producer-consumer scheme: a function enter hook (which cannot run managed code) enqueues method IDs in a lock-free queue, and a consumer thread calls RequestReJIT on each dequeued ID. This forces the CLR to re-JIT the method on its next invocation, triggering the callback again.
Challenge 3: Gadget injection. When the analyst wants to inject a call to an Analyzer-defined method into a target's MSIL, the injected call instruction needs a metadata token referring to the target function—but that function does not exist in the target assembly's metadata. Since assemblies are immutable after load, references cannot be added later. The solution: at ModuleLoadFinished time (when modification is still allowed), Dyno injects a "gadget" reference into the target assembly's metadata. The gadget is a placeholder function in the Analyzer; the analyst implements it with arbitrary logic. Later, the MSIL patcher can use this pre-injected token to emit valid call instructions.
Target Patterns
RIFT-style regex-like patterns for MSIL modification are called Target Patterns in Dyno. They are regular expressions over byte sequences in the MSIL byte code. Each target pattern serves two purposes:
- Identification: Match the specific method to be patched, even across different samples with minor variations.
- Patching: Embed the replacement bytes directly in the pattern using named capture groups.
A pattern can also trigger a callback when matched, allowing the analyst to implement a state machine for context-dependent patching. This was used for the constructor-level stack check: the callback inspected local variable types (StackFrame, StackTrace, MethodBase) to confirm the correct method before patching.
Demo / Proof of Concept
▶ Watch: Result: C2 address and network IOCs recovered from obfuscated malware (52:15)
Three progressively complex demos were presented live:
Demo 1: Function Call Tracer
A minimal Analyzer with reJIT = true and no MSIL modification. On each JIT callback, the method name is resolved and printed to the console. Output on a simple "main calls dummy twice" program correctly showed main, dummy, dummy in order, proving re-JIT tracking of all calls. Implementation: ~20 lines of Analyzer code.
Demo 2: String Decryption Bypass
This demo targeted the obfuscated sample from the project's origin. The string decryption function was identified by signature. All ~7,000 call sites were enumerated using dnlib (which RIFT parses the assembly statically). ~4,000 unique integer operands (the keys passed to the decryption function) were deduplicated and collected.
The stack checks (two in total—one in the decryption function body, one in the obfuscator's class constructor) were patched:
- The
ldloc.sinstruction in the first check was replaced with an unconditional branch using a Target Pattern. - The constructor check used a callback-based pattern that verified the presence of
StackFrame,StackTrace, andMethodBaselocal variables before patching.
With both checks bypassed, the Analyzer invoked the string decryption function with each of the 4,000 unique operands. The operation completed in approximately one minute and successfully returned all decrypted strings, including a clear-text C2 network address.
Demo 3: Payload Dumping
A .NET dropper that downloads a payload, Base64-decodes it, stores the result in a member variable, then calls VirtualAlloc + CreateThread to execute it. The goal was to dump the decrypted shellcode.
Three injection points were identified:
- Before
VirtualAlloc: capture the size argument. - After
VirtualAlloc: record the returned pointer, associating it with its size. - Before
CreateThread: capture the buffer pointer passed as the thread function argument.
Using gadget injection, the Analyzer added dup, ldc.i4, and call instructions before CreateThread in the MSIL. The gadget function received the buffer pointer and size, performed a memory copy, and dumped the hex-encoded shellcode to the console. The demo ran successfully and produced the shellcode dump.
Defensive Implications
▶ Watch: Conclusion: generic deobfuscation working across .NET protectors (57:08)
- Scalable deobfuscation: The primary application is pipeline-based deobfuscation of large sets of .NET samples using commodity obfuscators. Once an Analyzer is written for a specific obfuscator family, all samples from that family can be processed automatically.
- C2 extraction at scale: Automatically harvesting C2 addresses from hundreds of obfuscated samples has direct value for threat intelligence feeds and network-based blocking.
- Payload dumping without sandbox detection: Dyno's instrumentation is transparent to the .NET CLR's anti-debugging mechanisms in most cases. The team noted that, unlike x86 DBI, there is no fundamental data/code duality problem in the .NET managed world, and the profiler interface is a legitimate, Microsoft-supported channel.
- CLR-native: no inlining bypass needed: Because the Profiler API includes
JITInliningcallbacks, analysts can be notified if the CLR decides to inline a method, preventing missed interception. Additionally, Dyno instructs the CLR to disable inlining globally during instrumentation sessions. - Limitations: The framework is not magic—Analyzers still require per-obfuscator-family development work. Obfuscators that don't use recoverable patterns, or that perform fundamentally different integrity checks, need new Analyzers. The team proposed a community model where Analyzers accumulate over time and are shared.
Key Takeaways
- The .NET Profiler API, accessed via environment variables that direct the CLR to load an analyst-controlled DLL, provides JIT interception, MSIL patching, and function hook installation—all the primitives needed for managed-code DBI.
- Writing the profiler in C# (using .NET's Native AOT compilation) is feasible and dramatically lowers the barrier to entry compared to C++.
- MSIL patching before JIT compilation cleanly bypasses runtime integrity checks because the checks are eliminated before they ever execute—a fundamentally different strategy from patching native code.
- Target Patterns provide a regex-over-bytes approach to MSIL patching that is fast to write and handles minor cross-sample variation.
- Gadget injection, enabled by reference pre-injection at
ModuleLoadFinishedtime, enables call instruction injection into otherwise immutable assemblies. - The framework (Dyno) was validated against a real commodity .NET obfuscator that uses call-stack type checking. All 4,000 unique encrypted strings were recovered in one automated run.
- The code is pending release; the team can be contacted directly for early access.
About the Speakers
Lars Wallenborn is a reverse engineer at CrowdStrike with a background in x86 systems but increasing focus on managed-code malware analysis. Steffen Haas is a reverse engineer who contributed to the core Dyno framework and profiler implementation. Tillmann Werner is a reverse engineer at CrowdStrike known for deep systems-level research and was a core contributor to the Dyno design. Lindsay Kaye is VP of Threat Intelligence at HUMAN Security, formerly at Recorded Future, with extensive experience in malware analysis and threat intelligence operations. All four collaborated on the Dyno project, developing it partly during the Chaos Communication Congress (CCC).
Reviews
Dr. Zero (Offensive Security Researcher) — STRONG ACCEPT
Four researchers weaponized the .NET Profiler API to bypass stack-checking obfuscation at scale — the architecture is clever, the demos deliver, and the tooling gap it fills is real.
Heather Calloway (CISO) — PASS
Sophisticated malware analysis tooling built by researchers who clearly know what they're doing — this is Zero's room, not mine, and I mean that as a compliment to both the research and the routing.