Accuracy Is Not Enough: Detecting Hidden Risk in CVE Impact Prediction
Keerthana Purushotham (IEEE)
Overview
In the dynamic landscape of cybersecurity, accurately assessing the impact of Common Vulnerabilities and Exposures (CVEs) is paramount for effective risk management. However, traditional reliance on simple accuracy metrics can create a false sense of security, masking critical vulnerabilities that could leave systems exposed. Keerthana Purushotham, a research scientist at Amazon and affiliated with IEEE, presented a compelling case at VulnCon, arguing that "accuracy is not enough" when predicting CVE impact. Her talk introduced a data-driven approach to detect hidden risks by focusing on more nuanced statistical measures, particularly those sensitive to undetected vulnerabilities.
Key moments
- 3:00 Communicating correctness across different definitions
- 5:00 Defining True/False Positives & Negatives
- 9:00 False negatives: The high-risk impact
- 11:40 Same accuracy, vastly different impact
- 16:00 CVE status changes and the 'miss' zone
- 22:00 Matthews Correlation Coefficient (MCC) for trust score
- 26:15 Applying the framework in day-to-day operations (Q&A)
Accuracy Is Not Enough: Detecting Hidden Risk in CVE Impact Prediction
Speakers: Keerthana Purushotham, Research Scientist, Amazon & IEEE
Conference: VulnCon
YouTube: https://www.youtube.com/watch?v=NyQy-oubdSI
Overview
In the dynamic landscape of cybersecurity, accurately assessing the impact of Common Vulnerabilities and Exposures (CVEs) is paramount for effective risk management. However, traditional reliance on simple accuracy metrics can create a false sense of security, masking critical vulnerabilities that could leave systems exposed. Keerthana Purushotham, a research scientist at Amazon and affiliated with IEEE, presented a compelling case at VulnCon, arguing that "accuracy is not enough" when predicting CVE impact. Her talk introduced a data-driven approach to detect hidden risks by focusing on more nuanced statistical measures, particularly those sensitive to undetected vulnerabilities.
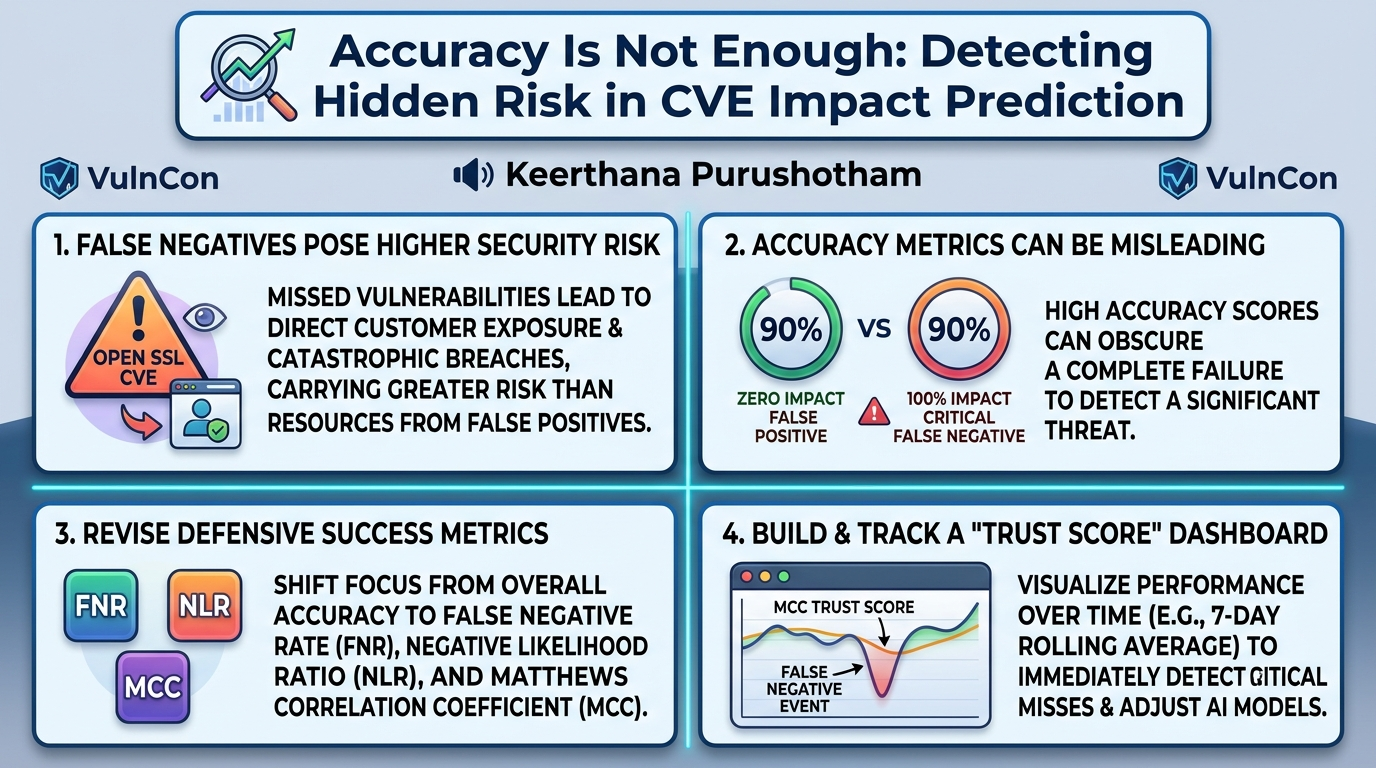
Purushotham's presentation delves into the inherent challenges of vulnerability management, where the true impact of a CVE can evolve over time and vary significantly across different system configurations. She highlights that while minimizing false positives (over-flagging non-vulnerable issues) is important to conserve resources, the far greater security risk lies in false negatives – vulnerabilities that are mistakenly classified as non-impacting. These missed vulnerabilities can lead to significant customer exposure and catastrophic breaches.
The core of her work proposes a shift from a singular focus on overall accuracy to a comprehensive dashboard utilizing metrics such as False Negative Rate (FNR), Negative Likelihood Ratio (NLR), and the Matthews Correlation Coefficient (MCC). By tracking these indicators, organizations can develop a more reliable "trust score" for their vulnerability prediction systems, ensuring that they are not only "correct" but also effectively identifying and mitigating the most dangerous threats. This analytical framework is crucial for both vulnerability researchers defining CVE impacts and organizations consuming that information to protect their assets.
Background
▶ Watch: Communicating correctness across different definitions (3:00)
The process of vulnerability impact assessment is inherently complex and highly contextual. As Purushotham explains, a single CVE ID is not static; its severity and impact can change as more information emerges, behaving like an "organic instance of a vulnerability." What might be a critical vulnerability for one organization could be non-impacting for another, depending on specific user configurations, enabled plugins, sandboxing measures, and network topology. For instance, Amazon Linux, Red Hat, Debian, and SUSE might each rate the same kernel CVE differently based on their unique distributions and customer use cases. Organizations must often evaluate CVE impact against their own unique configurations, sometimes even for unsupported, older versions of packages where upstream information is no longer available.
Modern security operations increasingly rely on automated tools, often leveraging AI and machine learning, to predict CVE impact. However, the speaker cautions against blindly trusting these tools based solely on overall accuracy. She defines the four fundamental outcomes of any prediction system in security:
- True Positive (TP): An impacting vulnerability is correctly identified as impacting.
- True Negative (TN): A non-impacting vulnerability is correctly identified as non-impacting.
- False Positive (FP): A non-impacting vulnerability is incorrectly identified as impacting. This leads to wasted effort in investigating and remediating non-existent threats, causing "erosion of trust" among engineers and unnecessary system reboots and downtime for customers.
- False Negative (FN): An impacting vulnerability is incorrectly identified as non-impacting. This is the most critical outcome in vulnerability management, as it represents a missed threat, potentially exposing customers to zero-day exploits or vulnerabilities that the organization falsely believes it has addressed.
Purushotham emphasizes that while both false positives and false negatives incur costs, their risk profiles differ significantly in vulnerability management. False positives primarily incur resource and operational costs, whereas false negatives carry a much higher security impact, directly leading to customer exposure and potential data breaches. She draws a parallel to other domains like content moderation or space operations, where the costs of false positives and negatives might be more balanced, but in vulnerability management, the imperative is clear: minimize false negatives at all costs. This necessitates a shift in how we measure the effectiveness of our vulnerability prediction systems, moving beyond simple accuracy to metrics that specifically highlight and penalize these critical misses.
Key Findings
▶ Watch: False negatives: The high-risk impact (9:00)
The central and most critical finding presented is that accuracy alone is a misleading metric for vulnerability impact prediction. Keerthana Purushotham demonstrates this with a simple yet powerful hypothetical case study involving 10 CVEs. In this scenario, a prediction model achieves 90% accuracy in two different cases, but with vastly different security implications:
- Case 1 (90% Accuracy, Zero Impact): The model correctly identifies 9 out of 10 CVEs. The single error is a false positive, where a non-impacting kernel CVE is incorrectly flagged as affecting. While this wastes resources in investigation, it has "zero security impact" because no actual vulnerability is missed.
- Case 2 (90% Accuracy, 100% Impact): The model again achieves 90% accuracy. However, this time the single error is a false negative: a critical OpenSSL CVE (rated 9.8 severity) is mistakenly marked as not affected. Despite the identical accuracy score, the impact in this scenario is "100%," as a severe vulnerability goes unaddressed, leaving customers exposed.
This stark contrast highlights the core problem: a high accuracy score can completely obscure a critical failure to detect a significant threat. The speaker argues that being "blind to something that you should be able to see" is the primary challenge.
Another key finding relates to the dynamic nature of CVE information. A CVE's status and impact assessment can change over time. Initially, a CVE might be announced with a low impact or declared "not affected." However, subsequent information from sources like Authorized Data Publishers (ADPs) or exploitation reports can contradict the initial assessment, leading to a "disputed" status. This period of conflicting information represents a "drift zone" where the initial prediction deviates from the evolving reality. Organizations need robust mechanisms to identify this "conflict time" and adjust their assessments accordingly.
The presentation underscores that without proper visualization and focus on specific metrics beyond accuracy, these critical false negatives can remain hidden, leading to a false sense of security and potentially severe consequences. The goal is to not just track the "actual data" but to visualize how "incorrect we are" and if changes to prediction systems are truly leading to improvement or a loss of accuracy, especially concerning the most impactful vulnerabilities.
Technical Deep Dive
▶ Watch: Same accuracy, vastly different impact (11:40)
To address the shortcomings of simple accuracy, Purushotham advocates for a comprehensive set of metrics, starting with the foundational components of any classification problem: True Positives (TP), True Negatives (TN), False Positives (FP), and False Negatives (FN). While Accuracy (TP + TN) / (TP + TN + FP + FN) is a starting point, it treats all errors equally, which is problematic in vulnerability management.
The speaker introduces a series of more granular metrics that provide deeper insights:
- Precision (Positive Predictive Value): TP / (TP + FP) – Measures the proportion of correctly identified positive cases out of all cases predicted as positive. In security, it answers: "Of all the CVEs we said were impacting, how many actually were?"
- Recall (Sensitivity or True Positive Rate): TP / (TP + FN) – Measures the proportion of actual positive cases that were correctly identified. In security: "Of all the CVEs that were impacting, how many did we actually catch?" A high recall is crucial to minimize missed vulnerabilities.
- Specificity (True Negative Rate): TN / (TN + FP) – Measures the proportion of actual negative cases that were correctly identified. In security: "Of all the CVEs that were not impacting, how many did we correctly identify as non-impacting?"
While these metrics offer more detail, Purushotham zeroes in on those specifically designed to highlight the risk of false negatives:
- False Negative Rate (FNR): FN / (TP + FN) – This is simply 1 - Recall. It directly quantifies the proportion of actual impacting vulnerabilities that were missed. A high FNR is a direct indicator of significant security risk.
- Negative Likelihood Ratio (NLR): This metric is derived from Specificity and Sensitivity (or Recall and FNR) and is particularly useful in diagnostic testing to assess the probability of a condition being absent given a negative test result. In the context of CVE prediction, a lower NLR indicates a more reliable system when it predicts a non-impacting CVE. It helps quantify how much less likely a CVE is to be truly impacting if the system predicts it's not.
The ultimate metric proposed for a holistic "trust score" is the Matthews Correlation Coefficient (MCC). The MCC is a correlation coefficient between the observed and predicted binary classifications. It is considered a more balanced measure than accuracy or F1-score, especially when dealing with imbalanced datasets (which is common in vulnerability data, where impacting CVEs might be fewer than non-impacting ones). The MCC value ranges from -1 to +1, where:
- +1 represents a perfect prediction.
- 0 represents a random prediction.
- -1 represents a completely inverse prediction.
The formula for MCC is:
((TP TN) - (FP FN)) / sqrt((TP + FP) (TP + FN) (TN + FP) * (TN + FN))
The speaker suggests that by tracking the MCC, alongside FNR and NLR, on a rolling basis (e.g., 3-day or 7-day windows), organizations can visualize their prediction system's performance. A dashboard showing MCC would ideally remain high and stable, but a significant drop would immediately signal a critical false negative event. This allows for continuous evaluation of "trust" in the prediction model.
Furthermore, Purushotham highlights that these metrics can be calculated using existing vulnerability schemas like CVE and OSV, leveraging fields such as default status (e.g., "unaffected") and ADP-related fields that indicate disputes or conflicting information. Simple automations can feed this data into a system to calculate FNR, NLR, and MCC, enabling the creation of powerful, actionable dashboards. The ability to track these metrics not just overall, but also for specific packages, Special Interest Groups (SIGs), or even configurations, allows for targeted improvements and a deeper understanding of where prediction models might be failing.
Demo / Proof of Concept
▶ Watch: Matthews Correlation Coefficient (MCC) for trust score (22:00)
While the talk did not feature a live code demonstration, Keerthana Purushotham presented a clear conceptual visualization of how the proposed metrics could be integrated into an actionable dashboard. She showed graphical representations of expected trends for False Negative Rate (FNR) and Matthews Correlation Coefficient (MCC) over time, illustrating how these metrics would react to critical events.
The dashboard concept involves continuously tracking FNR, NLR, and MCC, perhaps on a 7-day rolling basis or a chosen time window (e.g., 3 days). In such a visualization:
- A period of stable, high MCC and low FNR would indicate a trustworthy prediction system.
- The moment a false negative occurs (e.g., a critical OpenSSL CVE is missed), the MCC "trust score" would experience a noticeable dip, clearly indicated by a "blue arrow" in her example. Conversely, the FNR would spike.
- As the system corrects itself or more true positives and true negatives are correctly identified, the MCC would gradually increase again.
This visual feedback loop is crucial because, as Purushotham noted, a single false negative event might barely register as a "slight little dip" in a simple accuracy graph, or even look like a "flat line" across thousands of CVEs. However, when contrasted against other less relevant false values using metrics like FNR and MCC, a false negative would stand out as a significant "peak" or a sharp decline in trust.
The speaker expressed her intent to develop an open-source version of such a dashboard, inviting attendees to follow her on GitHub. This initiative aims to make these advanced analytical tools accessible for broader adoption, allowing organizations to easily implement the reconciliation logic and visualization techniques discussed. The conceptual demo effectively conveyed the power of these metrics in providing immediate, clear signals about the true security posture, enabling timely adjustments to automation and AI models to prevent future misses.
Defensive Implications
▶ Watch: Applying the framework in day-to-day operations (Q&A) (26:15)
The insights from Keerthana Purushotham's talk offer profound defensive implications for any organization involved in vulnerability management, from CVE Numbering Authorities (CNAs) to end-user enterprises. The primary call to action is to move beyond superficial accuracy metrics and adopt a more sophisticated, risk-aware approach to assessing vulnerability prediction systems.
Defenders should immediately prioritize the following actions:
- Redefine Success Metrics: Shift the focus from overall accuracy to metrics that specifically highlight and penalize false negatives. Implement tracking for False Negative Rate (FNR), Negative Likelihood Ratio (NLR), and the Matthews Correlation Coefficient (MCC) as core indicators of prediction system performance.
- Build Trust Score Dashboards: Develop internal dashboards that visualize these advanced metrics over time (e.g., a 7-day rolling average or 3-day window). These dashboards should serve as a "trust score" for vulnerability prediction automation, providing immediate alerts when the system's reliability dips due to missed vulnerabilities. This can be done for individual packages, Special Interest Groups (SIGs), or across the entire software estate.
- Proactive Data Reconciliation: Establish processes to continuously reconcile internal vulnerability assessments with external, authoritative sources. Monitor Authorized Data Publishers (ADPs), exploitability reports, and other intelligence feeds for conflicting information or disputes regarding CVE impact. This vigilance is crucial for identifying "drift zones" where initial predictions might diverge from the evolving reality of a vulnerability.
- Automate Metric Calculation: Leverage existing vulnerability data schemas (like CVE and OSV) and their fields (e.g., default status, ADP-related flags) to automate the calculation of FNR, NLR, and MCC. This ensures that the metrics are consistently generated and available for real-time analysis.
- Feedback Loop for AI/Automation: Use the insights gained from these metrics to create a robust feedback loop for AI and automation systems. When a drop in MCC or a spike in FNR is detected, it should trigger a review of the underlying prediction logic or models, allowing for targeted improvements to prevent similar false negatives in the future. This ensures that AI-driven vulnerability management systems are continuously learning and improving their ability to identify critical threats.
- Resource Allocation Based on Risk: While false positives incur costs, defenders should understand that these are primarily resource expenditures. False negatives, however, represent direct security exposure. By prioritizing the reduction of false negatives through improved metrics and processes, organizations can allocate their security resources more effectively to address the most pressing risks.
By embracing these advanced analytical techniques, organizations can build more resilient, trustworthy, and ultimately more secure vulnerability management programs that effectively detect and mitigate hidden risks before they become catastrophic incidents.
Key Takeaways
- Accuracy is insufficient and misleading: Relying solely on overall accuracy for vulnerability impact prediction can mask critical security risks, particularly missed vulnerabilities.
- False negatives are the paramount risk: In vulnerability management, the cost of a false negative (a missed vulnerability leading to customer exposure) is significantly higher than that of a false positive (wasted effort on a non-issue).
- Adopt advanced metrics: Metrics like False Negative Rate (FNR), Negative Likelihood Ratio (NLR), and especially the Matthews Correlation Coefficient (MCC) provide a more accurate and balanced assessment of a prediction system's performance, highlighting true security posture.
- Track a "trust score" over time: Implement dashboards to visualize MCC on a rolling basis (e.g., 3-day or 7-day window) to track the "trust score" of vulnerability prediction automation, enabling immediate detection of critical misses.
- Proactive data reconciliation is vital: Continuously monitor external sources like Authorized Data Publishers (ADPs) and exploitation reports to identify "drift zones" and "conflict times" where initial CVE assessments may change, allowing for timely updates to internal predictions.
- Automate and refine: Leverage existing vulnerability schema data (CVE, OSV) to automate the calculation of these metrics, fostering a continuous feedback loop to improve AI and automation in vulnerability management.
About the Speaker(s)
Keerthana Purushotham is a research scientist currently working at Amazon, with an affiliation with IEEE. Her work focuses on applying data science principles to the field of security, specifically addressing the challenges of accurately predicting and assessing the impact of vulnerabilities. Purushotham's expertise lies in developing robust methodologies for evaluating the correctness and trustworthiness of security classification and prediction models, moving beyond traditional, potentially misleading metrics to uncover hidden risks. Her insights are grounded in practical experience within large-scale vulnerability management contexts, such as those found at Amazon Linux.
Reviews
Dr. Zero (Offensive Security Researcher) — SOLID
Competent stats-101 talk applied to vuln management that makes one correct point — FNR matters more than accuracy for security classification — then stretches it into 20 minutes. The MCC recommendation is fine but hardly novel; anyone who's done ML eval knows accuracy is garbage for imbalanced classes. No real system shown, no data shared, no code dropped.
Heather Calloway (CISO) — SOLID
Solid, well-articulated argument that accuracy metrics hide false negatives in vuln prediction systems. The statistical framework is sound and the MCC dashboard concept is practical. Worth watching if you're evaluating or building vuln management automation, but the insight is narrower than the title suggests.
→ Top-rated talks at CVE/FIRST VulnCon 2026 & Annual CNA Summit