How EPSS Is Wrong and Useful at the Same Time
Jay Jacobs (Chief Data Scientist · Empirical Security)
Overview
In this compelling FIRSTCON talk, Jay Jacobs, a chief data scientist and one of the original creators of the Exploit Prediction Scoring System (EPSS), delves into the paradox inherent in EPSS: how it can be both "wrong" and incredibly "useful" simultaneously. Jacobs addresses common criticisms of EPSS head-on, acknowledging its limitations while rigorously demonstrating its superior performance in prioritizing vulnerabilities compared to traditional methods like CVSS. The core of his argument centers on the dynamic, data-driven, and probabilistic nature of EPSS, which is designed to predict the likelihood of exploitation activity within a 30-day window, a stark contrast to static severity scores.
Key moments
- 0:00 Introduction and astonishing CVE growth rate
- 4:05 Why EPSS is 'wrong': common criticisms and design choices
- 8:00 Incomplete exploitation data: The challenge of finding it
- 14:00 Understanding the unintuitive EPSS score distribution
- 24:00 How EPSS works: XG Boost decision trees explained
- 30:00 Measuring EPSS performance: Effort, efficiency, and coverage
- 38:00 EPSS in a post-Mythos/AI world (Q&A)
How EPSS Is Wrong and Useful at the Same Time
Speakers: Jay Jacobs, Chief Data Scientist, Empirical Security
Conference: FIRSTCON
YouTube: https://www.youtube.com/watch?v=okDWXuqgWu4
Overview
In this compelling FIRSTCON talk, Jay Jacobs, a chief data scientist and one of the original creators of the Exploit Prediction Scoring System (EPSS), delves into the paradox inherent in EPSS: how it can be both "wrong" and incredibly "useful" simultaneously. Jacobs addresses common criticisms of EPSS head-on, acknowledging its limitations while rigorously demonstrating its superior performance in prioritizing vulnerabilities compared to traditional methods like CVSS. The core of his argument centers on the dynamic, data-driven, and probabilistic nature of EPSS, which is designed to predict the likelihood of exploitation activity within a 30-day window, a stark contrast to static severity scores.
The talk is crucial for anyone involved in vulnerability management, risk assessment, or security data analysis. Jacobs, who also runs the EPSS Special Interest Group (SIG) within FIRST and is involved in the CVE program, brings a unique insider perspective to the challenges of collecting exploitation data and building predictive models in a rapidly evolving threat landscape. He emphasizes that perfection is an unattainable and unnecessary goal; instead, EPSS aims to be better than alternatives in helping defenders allocate limited resources more effectively.
Jacobs’ presentation is not just an academic defense of EPSS but a practical guide to understanding its mechanics, its performance metrics, and its profound implications for cybersecurity strategy. By dissecting the model's architecture, its reliance on a vast array of features, and its continuous calibration, he illuminates why EPSS offers a more intelligent and adaptable approach to identifying the vulnerabilities that truly matter to attackers.
Background
▶ Watch: Introduction and astonishing CVE growth rate (0:00)
The sheer volume of newly disclosed vulnerabilities presents an overwhelming challenge for organizations worldwide. Jay Jacobs starkly illustrates this by noting that in the 12 months leading up to his talk, approximately 58,770 vulnerabilities were published—a number comparable to the total published in the first 15 years of the CVE program. This exponential growth makes traditional, manual, or static prioritization methods untenable, pushing security teams to seek more efficient and accurate ways to identify which vulnerabilities pose the most immediate threat.
This is the problem EPSS was designed to address. Introduced as a data-driven, machine learning (ML) approach, EPSS estimates the probability that a given vulnerability will experience exploitation activity in the wild within the next 30 days. Unlike the static scores provided by systems like CVSS (Common Vulnerability Scoring System), EPSS scores are dynamic, fluctuating daily as new information emerges and patterns of exploitation evolve. For instance, early in a vulnerability's lifecycle, with limited information (e.g., no CVSS score or CPE), EPSS might have a low score. As more data becomes available—such as increased references, the development of scanning tools, or observed exploit attempts—the EPSS score will react and adjust, reflecting the changing threat landscape.
Jacobs openly addresses several common criticisms of EPSS. Critics often argue that EPSS predicts for the general population, not an individual environment, which Jacobs acknowledges as an inherent limitation due to the impossibility of modeling every unique organizational context. Other points of contention include scores for new CVEs based on thin evidence, the exclusive focus on exploitation activity (which Jacobs clarifies is a deliberate design choice for risk assessment, separating threat from impact and defensive capability), and the incomplete nature of exploitation activity labels—a significant focus of the talk. Finally, the unintuitive nature of probability itself is cited as a challenge. However, Jacobs frames these not as fatal flaws but as characteristics that, when understood, highlight EPSS's unique utility in an imperfect world, where the goal is not perfection but measurable improvement over existing alternatives.
Key Findings
▶ Watch: Incomplete exploitation data: The challenge of finding it (8:00)
The talk reveals several critical findings about the nature of vulnerability exploitation and the performance of EPSS:
- Incomplete Exploitation Data: A foundational challenge is the extreme difficulty in obtaining comprehensive data on actual exploitation activity. Jacobs explains that many security tools (e.g., SOC-based systems, EDRs, IPS/IDS) are designed to block threats or identify malware, not necessarily to precisely map observed activity to specific CVEs. This leads to a significant blind spot; for example, out of 1,367 CVEs added to CISA's KEV list over a year ago, it's impossible for most organizations to confidently say how many are currently being exploited. This incompleteness of "ground truth" data is precisely why modeling is essential.
- Vast Discrepancy in Observed Exploitation: EPSS's internal data collection, aggregated from multiple commercial and honeypot sources, identifies approximately 8,000 vulnerabilities with observed exploitation activity in any given 30-day window. Over its lifetime, EPSS has tracked activity for over 18,000 unique CVEs. This is significantly higher than CISA's KEV list, which focuses on known, successful exploitation and contained 1,367 entries at the time of the talk. While different in purpose, this comparison highlights that both data sets are "right" in their own context but collectively underscore how much exploitation activity goes unobserved by any single source.
- Exploitation is Temporal, Not Binary: Jacobs emphasizes that exploitation is not a static state ("exploited in the wild is true") but a temporal phenomenon. A vulnerability might be actively exploited one month and not the next. This temporal nature necessitates a dynamic scoring system like EPSS, which continuously updates its predictions based on recent activity.
- Low Base Rate of Exploitation: Despite the massive number of published CVEs (over 360,000 in total), only a small fraction are actively exploited. Jacobs estimates that in any 30-day period, approximately 2-2.5% of published vulnerabilities show observed exploitation activity, with the KEV list representing less than 0.5% of that. This low base rate makes accurate prioritization critical.
- EPSS Score Distribution: The distribution of EPSS scores is highly skewed, resembling an exponential or log-scale curve, not a bell curve or uniform distribution. A vast majority of vulnerabilities score very low (e.g., 200,000 vulnerabilities below 1% EPSS score). Conversely, only about 17,000 vulnerabilities (roughly 5% of published CVEs) have an EPSS score higher than 10%. This distribution is intuitive given the low base rate of actual exploitation.
- The Utility of Modeling Incomplete Data: Jacobs argues that the incompleteness of exploitation data does not render modeling useless ("garbage in, garbage out"). Instead, it necessitates modeling. EPSS can identify vulnerabilities with high scores that should be exploited (based on characteristics of other exploited CVEs) even if no activity is currently observed, prompting proactive defensive measures. Conversely, it can flag low-scoring vulnerabilities with observed exploitation as potential "flukes" or highly targeted attacks, requiring different investigative approaches.
- Probability is Unintuitive but Powerful: While probability is inherently difficult for humans to grasp (as famously quipped by David Spiegel), its mathematical properties are invaluable. EPSS's output as a ratio (0-1) allows for combinatorial calculations, enabling security teams to assess aggregate risk for an entire host or environment (e.g., "What is the probability that one or more vulnerabilities on this host will be exploited in the next 30 days?"). This is impossible with ordinal scales like CVSS.
- Model Calibration is Key: EPSS is designed to be calibrated, meaning that if it predicts a 1% chance of exploitation, approximately 1% of vulnerabilities in that score range should indeed see exploitation activity. Version 5 (released just before the talk) shows improved calibration, especially at higher probabilities, demonstrating continuous refinement.
Technical Deep Dive
▶ Watch: Understanding the unintuitive EPSS score distribution (14:00)
EPSS's predictive power stems from a sophisticated machine learning pipeline that processes vast amounts of data and employs advanced algorithms. Jay Jacobs provides a clear, albeit high-level, look into its technical underpinnings.
The foundation of EPSS is its training data, structured as an enormous matrix. Each row in this matrix represents a specific CVE on a particular date (e.g., "CVE-2023-1234 on March 1, 2026"). Each column corresponds to one of the model's features, which are various characteristics and contextual indicators related to the vulnerability. EPSS currently utilizes over 2,800 features, encompassing a wide array of data points—from CVE metadata (e.g., CVSS scores, CPE information, reference counts) to real-time threat intelligence indicators (e.g., mentions in exploit databases, security blogs, GitHub repositories).
This matrix is immense, containing approximately 110 million rows (CVE-date combinations) and 2,800 columns. Crucially, a specific column on the left side of this matrix serves as the label or target variable: a binary indicator (or a quantified measure) of whether exploitation activity was observed for that CVE within the subsequent 30 days. This "benefit of hindsight" during training allows the model to learn the patterns that precede actual exploitation.
The core of the EPSS prediction engine is an algorithm called XGBoost (Extreme Gradient Boosting). XGBoost is an ensemble learning method that constructs a series of decision trees. Unlike a single, complex decision tree, XGBoost builds many simpler trees sequentially, with each new tree attempting to correct the errors of the previous ones.
Jacobs illustrates this with a visual representation of the first decision tree in a simplified EPSS model. The process begins by identifying the most predictive feature to make the initial split. In EPSS, the Metasploit framework is often the very first feature examined. Jacobs notes that over 80% of Metasploit modules show observed exploitation activity in EPSS's data sources, making it an extremely strong indicator.
If a vulnerability is associated with a Metasploit module, the decision path goes one way; if not, it goes another. Each path then leads to another decision point, examining a different feature. For example, the next feature might be GitHub repo v2, which tracks mentions and repositories related to exploits on GitHub. The model learns to set specific thresholds (e.g., "if GitHub repo mentions > 70") to further refine the prediction. This process continues, creating a branching tree structure.
At the "bottom" of each decision path, in what's called a leaf node, the tree outputs an uncalibrated probability or a "weight." This process is repeated for many trees (e.g., 100 trees in Jacobs' example). The final uncalibrated score for a CVE is an aggregation of the outputs from all these trees. This raw score is then calibrated against observed exploitation rates to produce the final 0-1 (0-100%) probability score that EPSS provides.
Jacobs also explains why EPSS doesn't release its underlying model. The 2,800 features are not just raw data points; they are carefully engineered and preprocessed based on EPSS's specific data collection methodologies and internal decisions (e.g., how to interpret CVE mentions in description fields). If the model were released, external users feeding in their own data—which would inevitably differ in its preparation and nuances—would lead to inconsistent and inaccurate results, making support impractical for a volunteer-driven project. This highlights the intricate relationship between data engineering and model performance in real-world ML systems.
Demo / Proof of Concept
▶ Watch: Measuring EPSS performance: Effort, efficiency, and coverage (30:00)
While the talk did not feature a live, interactive demonstration of an exploit or a tool, Jay Jacobs presented compelling data visualizations and performance metrics that served as a powerful "proof of concept" for EPSS's effectiveness. The core of this demonstration focused on comparing EPSS's ability to prioritize vulnerabilities against the widely used CVSS, using three key metrics:
- Effort: The percentage of all published vulnerabilities that an organization would need to prioritize or remediate.
- Efficiency (Precision): Out of the vulnerabilities prioritized, what percentage are actually exploited? A higher efficiency means less wasted effort.
- Coverage (Recall): Out of all the vulnerabilities that are actually exploited, what percentage did the prioritization method identify? Higher coverage means fewer missed critical threats.
Jacobs illustrated these concepts with Venn diagrams, showing the overlap (or lack thereof) between vulnerabilities scored as "critical" by CVSS (e.g., CVSS 9 and above, representing 21% of all published CVEs) and the much smaller set of vulnerabilities that are actually exploited (the "red circle" in his diagrams). He demonstrated that relying solely on CVSS 9+ leads to prioritizing a large number of vulnerabilities, but with low efficiency; only about 5% of those prioritized by CVSS 9+ are actively exploited.
The most impactful part of the "demo" involved Precision-Recall curves and Coverage vs. Effort plots. These visualizations graphically represented EPSS's superior performance:
- Precision-Recall Curve: This plot shows the trade-off between identifying true positives (precision) and finding all positives (recall). EPSS (both V4 and the newer V5) consistently plots significantly higher and further to the upper-right than CVSS. A perfect system would be in the top-right corner. CVSS, especially at lower thresholds, shows a relatively inefficient curve, barely outperforming a "random guess" baseline. EPSS, by contrast, demonstrates a much steeper curve, indicating it can achieve high recall (coverage) with much higher precision (efficiency).
- Coverage vs. Effort Plot: This plot directly addresses the practical challenge of resource allocation. It shows how much effort (percentage of vulnerabilities needing remediation) is required to achieve a certain level of coverage (percentage of exploited vulnerabilities identified). Jacobs highlighted that to achieve 80% coverage of exploited vulnerabilities, EPSS requires significantly less effort (e.g., around 10-20% of vulnerabilities) compared to CVSS (which would require addressing a much larger percentage, potentially equivalent to all CVSS 9.x+ vulnerabilities). The V5 model showed a further "lift," indicating improved performance over V4. The baseline for random guessing is a straight diagonal line; EPSS's curve is sharply concave, demonstrating its strong predictive power.
Jacobs also stressed that these performance metrics are not hypothetical. They are calculated by taking EPSS scores, waiting 30 days, and then comparing predictions against actual observed exploitation data collected by EPSS, as well as against independent "ground truth" lists like CISA's KEV and VulnCheck KEV. Across these different ground truths, EPSS consistently demonstrated substantial improvements over CVSS, reinforcing its utility as a practical prioritization tool.
Defensive Implications
▶ Watch: EPSS in a post-Mythos/AI world (Q&A) (38:00)
The insights presented in this talk have profound implications for defensive security strategies, particularly in vulnerability management and risk assessment. Organizations can leverage EPSS to transform their approach from reactive, broad-stroke remediation to proactive, precision-targeted defense.
- Revolutionized Prioritization: The most immediate and significant implication is the ability to dramatically improve vulnerability prioritization. Instead of chasing every high-severity CVE (which can be 21% of all published vulnerabilities according to CVSS 9+), EPSS allows defenders to focus on the small fraction (2-2.5%) that are most likely to be actively exploited. This allows security teams to allocate resources more effectively, addressing the most pressing threats first and reducing the backlog of less critical vulnerabilities.
- Dynamic Risk Assessment: EPSS's daily, dynamic scoring provides a real-time understanding of the threat landscape. This moves organizations beyond static risk assessments, enabling them to adapt quickly to emerging exploit trends. Defenders can monitor EPSS scores for their assets and prioritize remediation efforts as scores fluctuate, reflecting new exploit intelligence or changes in attacker behavior.
- Optimized Resource Allocation: By achieving high coverage (identifying a large percentage of exploited vulnerabilities) with significantly less effort (prioritizing a smaller percentage of all vulnerabilities), EPSS helps security teams make the most of their often-limited resources. This means fewer hours spent patching vulnerabilities that are unlikely to be exploited and more time dedicated to hardening defenses against actual threats.
- Proactive Threat Identification: EPSS can highlight vulnerabilities with high scores for which no exploitation activity has yet been observed. This is not a flaw but an opportunity for proactive defense. These "should be exploited" vulnerabilities might warrant increased monitoring, the development of custom detection signatures, or immediate patching, as they possess characteristics similar to other actively exploited CVEs.
- Enhanced Risk Aggregation: The probabilistic nature of EPSS scores allows for mathematical operations, such as combining probabilities across multiple vulnerabilities on a single host or within an entire environment. This enables security leaders to calculate aggregate risk metrics, providing a more holistic view of their attack surface and informing strategic decisions about asset protection.
- Adapting to an Evolving Threat Landscape: Jacobs touched upon the "post-mythos world" (referring to the shifting landscape with AI and other advanced threats). He argued that EPSS's core strength—its continuous feedback loop and machine learning capabilities—positions it well to adapt to these changes. Defenders should embrace similar feedback mechanisms in their own security operations to remain agile and responsive to new attack vectors.
- Informed SLA Development: While probability can be unintuitive, understanding EPSS's calibration can inform the establishment of more realistic Service Level Agreements (SLAs) for vulnerability remediation. For instance, an SLA might mandate patching all vulnerabilities above a certain EPSS percentile (e.g., top 10%), rather than an arbitrary CVSS threshold. This ensures that remediation efforts are aligned with actual exploit likelihood.
By integrating EPSS into their vulnerability management programs, organizations can shift from a reactive, volume-based approach to a predictive, intelligence-driven strategy, ultimately enhancing their defensive posture against the most impactful threats.
Key Takeaways
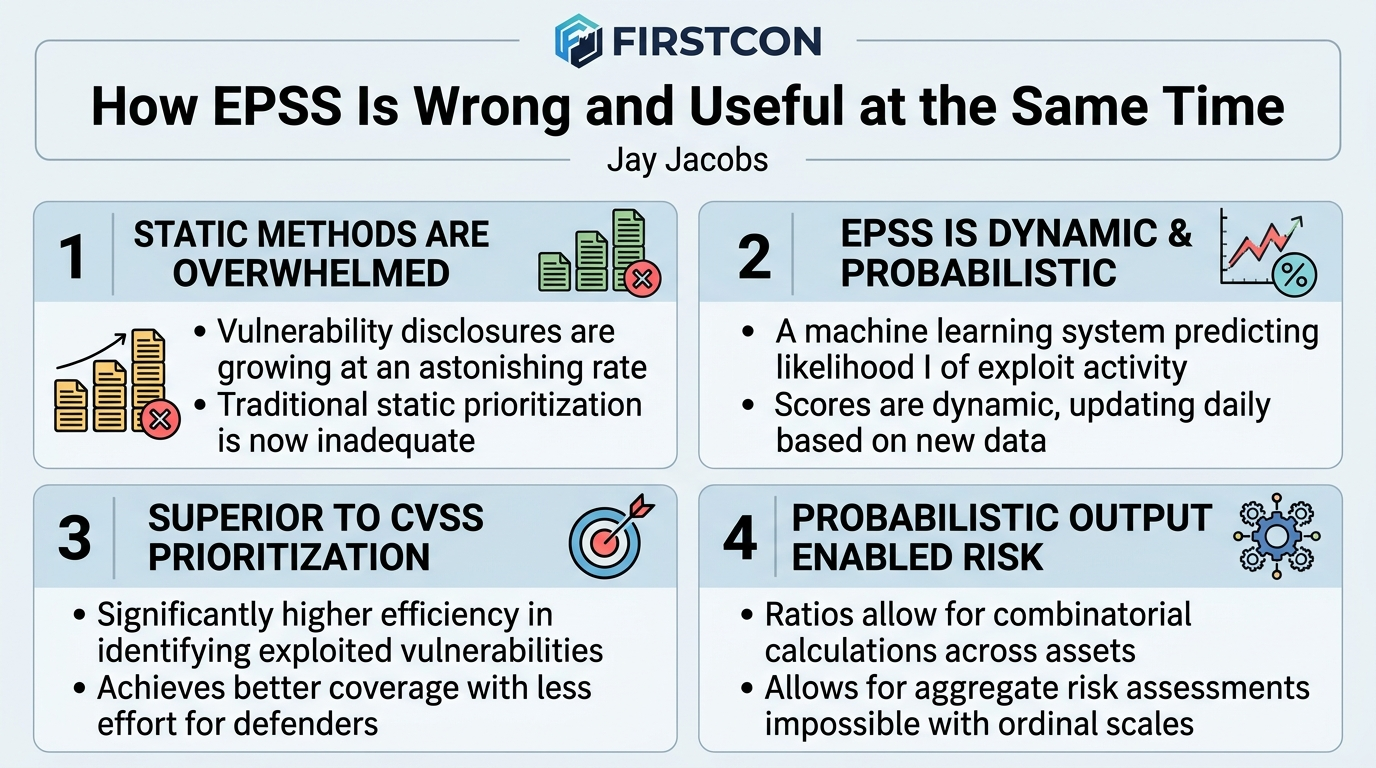
- The volume of published vulnerabilities is growing at an astonishing rate, making traditional, static prioritization methods inadequate for effective risk management.
- EPSS is a dynamic, machine learning-driven system that predicts the probability of exploitation activity within 30 days, offering a crucial distinction from static severity scores like CVSS.
- Exploitation data is inherently incomplete and temporal, but EPSS's modeling approach is designed to function effectively despite these limitations, identifying both observed and high-potential, unobserved threats.
- EPSS significantly outperforms CVSS in terms of efficiency (prioritizing exploited vulnerabilities more accurately) and coverage (identifying a higher percentage of exploited vulnerabilities with less effort).
- The probabilistic output of EPSS allows for advanced mathematical operations, enabling more sophisticated risk calculations for individual assets or entire environments, which is impossible with ordinal scoring systems.
- Continuous model improvement and calibration (as demonstrated by EPSS V5) are vital for adapting to the evolving threat landscape and maintaining predictive accuracy in the face of new attack patterns and data sources.
About the Speaker(s)
Jay Jacobs is the Chief Data Scientist at Empirical Security, a company he co-founded. He is a recognized expert in data analysis and cybersecurity, known for his extensive work in the vulnerability space. Jacobs is one of the original creators of the Exploit Prediction Scoring System (EPSS) and currently runs the EPSS Special Interest Group (SIG) within FIRST (Forum of Incident Response and Security Teams). His involvement extends to the CVE program, where he leads the consumer working group. Before his current role, Jacobs contributed significantly to the field through his work with Fortinet and Kenna Security (later acquired by Cisco), where he helped integrate exploit activity data with vulnerability intelligence. With a long-standing passion for data visualization and understanding complex security data, Jay Jacobs brings a unique blend of technical expertise and practical experience to the challenges of vulnerability prioritization.
Reviews
Dr. Zero (Offensive Security Researcher) — STRONG ACCEPT
Jay Jacobs delivers exactly what a practitioner talk should: an honest, data-driven defense of a system he built, acknowledging its warts while proving it still beats the alternative. The XGBoost internals are surface-level but the performance metrics are rigorous, and the framing of 'wrong and useful' is genuinely clarifying for teams still fighting the CVSS-or-bust battle.
Heather Calloway (CISO) — STRONG ACCEPT
This is the clearest explanation I've seen of why EPSS works and where it breaks down. If your vulnerability management program still runs on CVSS thresholds, this talk makes the case for changing that. Worth your risk committee's time.
→ Top-rated talks at FIRSTCON26 — 38th Annual FIRST Conference