‾‾\___ʌ__.__
Gabriel Bassett
ShmooCon XX (Final) · Day 1 · One Track Mind
Overview
In the fast-evolving landscape of cybersecurity, professionals are constantly inundated with vast quantities of data, from network traffic logs to breach reports. Making sense of this deluge and extracting actionable intelligence is a formidable challenge. Gabriel Bassett's ShmooCon talk addresses this critical need by demystifying statistical distributions, presenting them not as intimidating mathematical constructs, but as essential tools for understanding, communicating, and making better decisions from cybersecurity data. Bassett champions the idea that these distributions are as fundamental and practical as any wrench or command-line utility, empowering analysts to move beyond simplistic averages and gain deeper insights into complex security phenomena.
Key moments
- 0:00 Introduction and demystifying statistical distributions
- 2:20 Challenges with raw data and visualizing distributions
- 4:00 Using percentiles to describe data and their caveats
- 5:30 Understanding frequentist distributions without the scary math
- 6:20 Applying a distribution to explain data outliers
- 7:10 Summary: Distributions are versatile tools for data analysis
Demystifying Statistical Distributions: A Practical Toolkit for Cybersecurity Professionals
Speakers: Gabriel Bassett
Conference: ShmooCon
YouTube: https://www.youtube.com/watch?v=wXbnUm88IJw
Overview
In the fast-evolving landscape of cybersecurity, professionals are constantly inundated with vast quantities of data, from network traffic logs to breach reports. Making sense of this deluge and extracting actionable intelligence is a formidable challenge. Gabriel Bassett's ShmooCon talk addresses this critical need by demystifying statistical distributions, presenting them not as intimidating mathematical constructs, but as essential tools for understanding, communicating, and making better decisions from cybersecurity data. Bassett champions the idea that these distributions are as fundamental and practical as any wrench or command-line utility, empowering analysts to move beyond simplistic averages and gain deeper insights into complex security phenomena.
The core premise of Bassett’s presentation is to bridge the gap between raw data and meaningful interpretation, particularly when dealing with uncertainty. He argues that while many security professionals intuitively grasp what a distribution "looks like," few truly understand the underlying mechanics or, more importantly, when and how to effectively apply them. By breaking down common misconceptions and focusing on practical applications, Bassett aims to equip the audience with the confidence to leverage these statistical methods for more accurate reporting, robust risk assessments, and proactive threat intelligence.
This talk is particularly significant because it tackles a pervasive problem in the industry: the misrepresentation or oversimplification of data, which can lead to flawed conclusions and inefficient resource allocation. Bassett emphasizes the ethical imperative of accurately communicating the inherent uncertainty in security metrics. By providing concrete examples derived from real-world cybersecurity scenarios, such as Verizon DBIR data and network port scans, he illustrates how distributions can transform ambiguous numbers into clear, actionable intelligence, ultimately fostering a more data-informed and resilient cybersecurity posture.
Background
▶ Watch: Introduction and demystifying statistical distributions (0:00)
The journey into understanding cybersecurity data often begins with an overwhelming amount of raw information. As Bassett highlights, a 10-gigabyte file of NetFlow data, for instance, is virtually impossible to comprehend by simply reading it from end to end. While searching for specific IPs or ports might be feasible, the true meaning—the patterns, anomalies, and underlying structure—remains elusive without proper aggregation and summarization. This is where the concept of a distribution becomes indispensable. A distribution takes disparate data points and organizes them to reveal how frequently different values occur, offering a holistic view of the dataset.
Initially, simple descriptive statistics like percentiles or quantiles can provide some insight. By dividing data into segments (e.g., the point below which 1% of data falls, 2%, etc.), one can gauge whether a new observation is "average" or an outlier. However, Bassett points out several critical limitations of this approach. Quantiles fail to describe data points outside the observed range, can be verbose and inefficient for frequent communication (e.g., hundreds of values per API call), and don't easily allow for understanding the difference or relationship between two points. This often necessitates a more sophisticated approach.
The next step often leads to the "scary" realm of frequentist distributions, characterized by their often intimidating names (like Logistic Cauchy or Beta-PERT) and complex mathematical formulas. Bassett masterfully cuts through this apprehension by asserting that the long, "funky ass names" are merely historical artifacts—the mathematician who derived the formula got to name it. For the practitioner, the crucial insight is that you don't have to understand the intricate math; you just need to understand the shape and when to use it. He likens this to using a wrench: you don't need to be an engineer to understand how to turn a bolt; you just need to pick the right size wrench for the job. This reframing is central to demystifying statistical methods for a cybersecurity audience.
Bassett also briefly touches upon Bayesian mathematics as another tool for data description. While not diving into its intricacies, he characterizes it with the principle that "if you know something now, the next thing you know probably had something to do with the last thing you knew." The overarching message is clear: whether frequentist, Bayesian, or simple descriptive statistics, these are all distinct tools, each with its own benefits, downsides, and specific applications, much like having different spatulas for different cooking tasks. The problem exists because security data is inherently complex, and the right tool is needed to extract meaningful, trustworthy insights.
Key Findings
▶ Watch: Using percentiles to describe data and their caveats (4:00)
Gabriel Bassett's talk distills several critical findings regarding the application of statistical distributions in cybersecurity, repositioning these often-feared mathematical concepts as accessible and powerful tools:
- Distributions are Tools, Not Just Math: The most foundational finding is that statistical distributions should be viewed pragmatically, akin to any other tool in a professional's arsenal—a wrench, a command-line utility, or a spatula. Their value lies in their utility for specific tasks, not in the complexity of their underlying equations. You don't need to be a statistician to use them effectively, just understand their purpose and when to apply them.
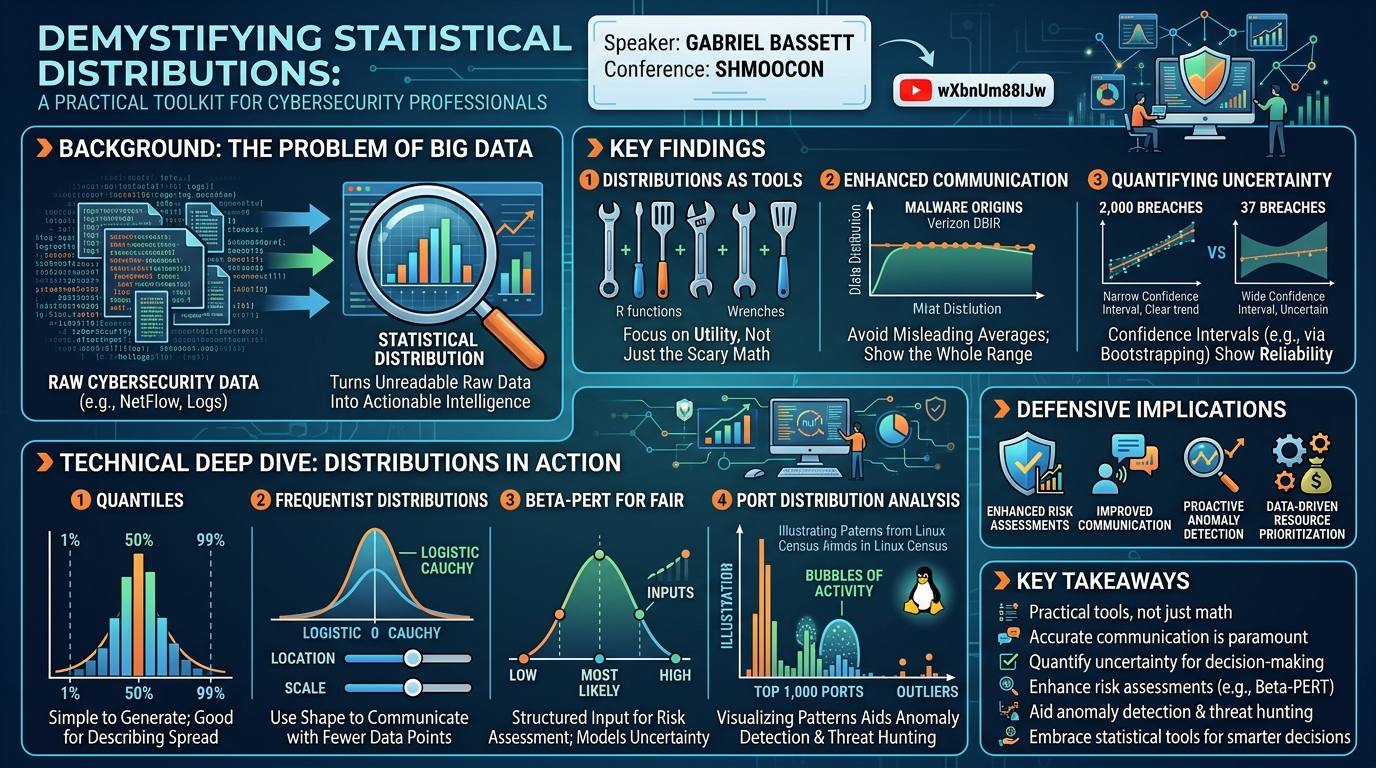
- Enhanced Data Communication: Distributions offer a superior method for communicating complex data compared to single point estimates (like averages or percentages). Bassett demonstrates this powerfully with an example from the Verizon Data Breach Investigations Report (DBIR). While a simple average might state "42% of malware comes as office documents," the underlying distribution might be flat, indicating that 25% is as common as 75%. Communicating the full distribution or relevant quantiles prevents misinterpretation and provides a more honest and accurate picture of the data, especially when the data doesn't conform to an assumed normal shape.
- Quantifying and Communicating Uncertainty: A significant contribution of the talk is its emphasis on the critical role distributions play in quantifying and communicating the inherent uncertainty in cybersecurity data. Bassett highlights that reporting a single number without its associated confidence interval can be misleading. Using examples of breach data (2,000 breaches vs. 37 breaches), he shows how confidence in assertions (e.g., credentials being more likely than phishing) drastically changes with sample size. Tools like bootstrapping or frequentist/Bayesian one-liners can easily generate these confidence levels, providing defenders with a more realistic understanding of the reliability of their metrics. This directly addresses the "lies, damn lies, and statistics" adage by promoting transparency.
- Structured Input for Risk Assessment: Distributions provide a robust framework for structuring input in risk assessments, particularly in methodologies like FAIR (Factor Analysis of Information Risk). The Beta-PERT distribution, for instance, allows analysts to communicate a range of possibilities (high, low, and most likely middle point) for variables like attack likelihood. This moves beyond arbitrary single-point estimates, enabling software to run sophisticated simulations and generate more realistic risk profiles for executive decision-making.
- Facilitating Exploration and Anomaly Detection: By visualizing the distribution of data, security professionals can quickly identify patterns, clusters, and outliers that warrant further investigation. Bassett's example of the distribution of common ports across millions of Linux computers illustrates this. Observing distinct "bubbles" of activity (e.g., at 10 million, 1 million, 100 thousand, and 10 thousand occurrences) can suggest different types of services or configurations (like open ports on unfirewalled systems). This exploratory power guides threat hunting and vulnerability identification, transforming raw data into actionable intelligence.
Technical Deep Dive
▶ Watch: Understanding frequentist distributions without the scary math (5:30)
The talk, while avoiding deep mathematical proofs, provides a compelling technical overview of how various statistical distributions are applied in cybersecurity contexts. Bassett emphasizes the practical implementation, often referring to "one-liner" or "two-liner" code examples in R (though not shown in detail, the conceptual ease is highlighted).
1. Describing Raw Data with Distributions:
Bassett begins with a foundational example: analyzing the ratio of data in to data out by IP address from a free online dataset. Simply looking at the raw data reveals little. However, plotting this as a distribution immediately shows key characteristics:
- A portion of data has more "in" than "out."
- Data is largely clustered around a zero point.
- Significant outliers exist on the edges.
This initial visualization transforms raw numbers into an understandable pattern, laying the groundwork for more advanced analysis.
2. Quantiles and Their Limitations:
To describe this distribution, Bassett first introduces percentiles or quantiles. This method involves identifying points below which a certain percentage of the data falls (e.g., the 1st percentile, 50th percentile, etc.). He notes that in R, this is often a simple one-line function call. While useful for determining if a new observation is "average" or within expected ranges, quantiles have drawbacks:
- They don't inherently describe data points outside the observed range.
- Communicating many quantiles (e.g., 100 percentiles for every API call) is inefficient.
- They struggle to easily represent the difference or relationship between two points.
3. Frequentist Distributions: Leveraging Shapes for Communication:
Bassett then introduces frequentist distributions, acknowledging their "scary" names and associated math. His key insight is that the names are arbitrary, and the focus should be on their shape and parameters.
- He specifically mentions the Logistic Cauchy distribution as an example. It resembles a normal distribution but is thinner, making it suitable for data with heavier tails (i.e., more extreme outliers).
- The power here is that a complex distribution can be communicated using just two values: its parameters. This dramatically reduces the data overhead compared to sending a hundred quantiles.
- The caveats are that one must select an appropriate shape, and the chosen distribution might not perfectly fit the empirical data, and there are underlying statistical assumptions that a "math teacher" might emphasize, but often don't hinder practical application.
4. Bayesian Approaches (Brief Mention):
While not delving into specifics, Bassett briefly references Bayesian math as an alternative tool. He characterizes it by the principle that "if you know something now, the next thing you know probably had something to do with the last thing you knew." This highlights that different statistical paradigms offer different ways to model and update understanding, serving as distinct tools for the same job of describing data.
5. Beta-PERT for Risk Assessment (FAIR):
A concrete application is the Beta-PERT distribution in FAIR (Factor Analysis of Information Risk) assessments. When asked to estimate the likelihood of an attacker exploiting a vulnerability, security professionals often struggle with single numbers. The Beta-PERT distribution allows for three inputs:
- A low estimate.
- A high estimate.
- A most likely middle point.
This enables the communication of a curve of possibilities, representing the inherent uncertainty in the estimate. This distribution then feeds into simulations (often depicted as Monte Carlo simulations) that provide a more robust risk picture to executives.
6. Quantifying Uncertainty with Breach Data:
Bassett underscores the importance of communicating uncertainty using real-world breach data. He contrasts analyses based on:
- 2,000 breaches: Showing a tight confidence interval (e.g., +/- 2%), where distinctions between attack vectors (like credentials vs. phishing) are clear and statistically significant.
- 37 breaches: Showing a much wider confidence interval (e.g., +/- 10%), where the overlap between different attack vectors makes confident assertions difficult.
He presents three methods for calculating these confidence intervals:
- A frequentist one-liner.
- A Bayesian one-liner.
- Bootstrapping, a "two-liner" method that directly samples from the data without making assumptions about its underlying distribution, described as feeling "clean" and less prone to worry about ignored assumptions.
7. Port Distribution Analysis for Anomaly Detection:
Finally, Bassett presents an example using census data of the top 1,000 ports across 19.5 million Linux computers. The distribution reveals distinct modes:
- A peak at 10 million occurrences (e.g., ports 80, 443, 22).
- Smaller "bubbles" around 1 million, 100,000, and a significant cluster around 10,000.
This visualization immediately sparks questions. For instance, inquiring about port 91 reveals it's not uncommon, falling within a high-density mode (69% of ports occur more often, 31% less). More interestingly, the "big bubble around 10,000" occurrences is hypothesized to represent "Linux computers put on the internet with all their ports open and no firewall." This demonstrates how distribution analysis can quickly highlight areas for further investigation, guiding threat hunting or vulnerability assessments based on observed prevalence.
Demo / Proof of Concept
▶ Watch: Applying a distribution to explain data outliers (6:20)
While Gabriel Bassett did not conduct a live, interactive demonstration during the talk, he effectively illustrated the application of statistical distributions through various real-world cybersecurity examples and accompanying R code snippets displayed on his slides. These snippets, described as "one-liner" or "two-liner" code, conceptually demonstrated how to perform tasks such as generating quantiles, fitting frequentist distributions, or performing bootstrapping to estimate confidence intervals. The intent was to show the accessibility and ease of implementation for these techniques using common statistical programming environments, rather than performing a step-by-step coding walkthrough. The examples provided, such as analyzing NetFlow data ratios, Verizon DBIR figures, and Linux port distributions, served as conceptual proofs of concept, highlighting the practical utility of these statistical tools in cybersecurity analysis.
Defensive Implications
▶ Watch: Summary: Distributions are versatile tools for data analysis (7:10)
The insights shared by Gabriel Bassett regarding statistical distributions carry profound implications for cybersecurity defenders, enabling them to move beyond reactive measures and embrace a more proactive, data-informed strategy.
1. Enhance Risk Assessment Accuracy: Defenders can significantly improve their risk assessments by adopting probabilistic approaches. Instead of relying on single-point estimates for likelihood or impact, using distributions like the Beta-PERT allows for the representation of uncertainty. This provides a more realistic range of potential outcomes for vulnerabilities and threats, leading to more robust FAIR (Factor Analysis of Information Risk) analyses. By communicating "high, low, and most likely" scenarios, security teams can present a nuanced risk picture to management, facilitating better resource allocation and strategic planning.
2. Improve Communication of Security Posture: A critical defensive implication is the ability to communicate security data more accurately and transparently. Defenders often present metrics like "X% of malware comes from Y source." However, as Bassett illustrated with the DBIR example, a single percentage can be highly misleading if the underlying data distribution is flat or skewed. By presenting quantiles or visualizing the full distribution, defenders can convey the true spread and variability of their data. This honesty about uncertainty (e.g., using confidence intervals derived from bootstrapping or frequentist methods) builds trust and ensures that stakeholders make decisions based on a complete understanding of the data's reliability, preventing misinterpretation of "lies, damn lies, and statistics."
3. Proactive Anomaly Detection and Threat Hunting: Distribution analysis is a powerful tool for anomaly detection and threat hunting. By understanding the "normal" distribution of network traffic, port usage (as seen in the Linux port example), user behavior, or system logs, defenders can quickly identify deviations that may indicate malicious activity, misconfigurations, or emerging threats. A sudden shift in the shape of a distribution, or the appearance of significant outliers, can trigger investigations that might otherwise go unnoticed. For instance, identifying clusters of unusual port activity (like the "10,000 bubble" of open ports) allows defenders to target specific hosts or segments for deeper inspection, potentially uncovering vulnerable systems or compromised assets.
4. Data-Driven Resource Prioritization: With limited budgets and personnel, effective resource prioritization is paramount. By leveraging statistical distributions, defenders can gain deeper insights into where their efforts will have the greatest impact. Understanding the distribution of vulnerabilities across an asset base, or the prevalence of specific attack vectors, allows for targeted interventions rather than blanket approaches. For example, if a distribution shows a high concentration of a particular type of misconfiguration, resources can be focused on remediation efforts that address that specific pattern, leading to more efficient and impactful security improvements.
5. Educate Stakeholders on Data Nuance: Defenders have an opportunity to educate their leadership and peers on the importance of statistical literacy. By demonstrating how distributions provide richer context than simple averages, they can foster a culture that demands more rigorous data analysis. This includes pushing back against reports that present numbers without confidence intervals or context, advocating for better visualization tools, and ensuring that strategic decisions are based on a comprehensive understanding of the data's true meaning and limitations.
Key Takeaways
- Statistical distributions are practical tools, not just complex math: They should be viewed as essential utilities for cybersecurity professionals, akin to wrenches or command-line tools, used when appropriate to solve specific data analysis problems.
- Accurate communication of data is paramount: Single numbers (averages, percentages) can be misleading. Distributions and quantiles provide a more honest and comprehensive picture, especially when data doesn't conform to expected patterns (e.g., the flat distribution of malware origins in DBIR).
- Quantifying uncertainty is critical for decision-making: Cybersecurity reports and assessments must communicate the confidence levels or inherent uncertainty in their metrics. Tools like bootstrapping or frequentist/Bayesian methods can easily provide this context, preventing misinterpretation and enabling better-informed actions.
- Distributions enhance risk assessments: Methods like the Beta-PERT distribution allow for structured input of high, low, and most likely values for risk variables, leading to more realistic and robust risk simulations (e.g., in FAIR assessments).
- Distribution analysis aids anomaly detection and threat hunting: Visualizing data distributions (e.g., network port usage) can quickly reveal patterns, clusters, and significant outliers that warrant further investigation, helping identify misconfigurations, vulnerable systems, or potential threats.
- Embrace statistical tools for smarter decisions: By overcoming the fear of "scary math" and focusing on the practical application of distributions, cybersecurity professionals can transform raw data into actionable intelligence, leading to more effective resource allocation and a stronger defensive posture.
About the Speaker(s)
Gabriel Bassett is a passionate and experienced cybersecurity professional with a strong background in data analysis and statistical methods. While specific titles and affiliations were not explicitly detailed in the talk, Bassett's expertise is evident through his work on the Verizon Data Breach Investigations Report (DBIR), where he contributed to the figures and analysis, demonstrating his deep understanding of real-world breach data. He also mentions being "in cinsa's" at one point, which could allude to a role within CISA (Cybersecurity and Infrastructure Security Agency), further indicating his involvement in government or public sector cybersecurity efforts. Bassett is dedicated to demystifying complex statistical concepts, making them accessible and actionable for the broader cybersecurity community, and advocating for more transparent and accurate data communication within the industry. His engaging presentation style and clear explanations resonated deeply with the ShmooCon audience, who praised his ability to simplify intimidating topics.
Reviews
Dr. Zero (Offensive Security Researcher) — STRONG ACCEPT
This talk, despite its visually unpolished slides, is a strong accept. Gabriel Bassett masterfully demystifies statistical distributions, presenting them as essential tools for cybersecurity professionals to accurately communicate risk and uncertainty. His ability to translate complex mathematical concepts into actionable insights for real-world scenarios, drawing on his experience with the Verizon DBIR, demonstrates deep practical knowledge and addresses a critical, often overlooked, deficiency in current security reporting and decision-making.
Heather Calloway (CISO) — STRONG ACCEPT
Gabriel Bassett's talk on statistical distributions is a critical intervention for cybersecurity leaders and practitioners. He effectively demystifies these concepts, reframing them as pragmatic tools essential for accurate risk communication, robust threat intelligence, and data-informed decision-making. By championing the honest quantification of uncertainty, Bassett provides a clear path for organizations to move beyond misleading single-point estimates, enabling more precise risk assessments and fostering greater accountability at all levels. This work directly empowers defenders to translate complex data into actionable intelligence, improving both operational effectiveness and…