Transforming Vulnerability Management with Advanced Dependency Knowledge Graphs
David Starobinski (Professor · Boston University), Sevval Simsek (PhD Student · Boston University)
Overview
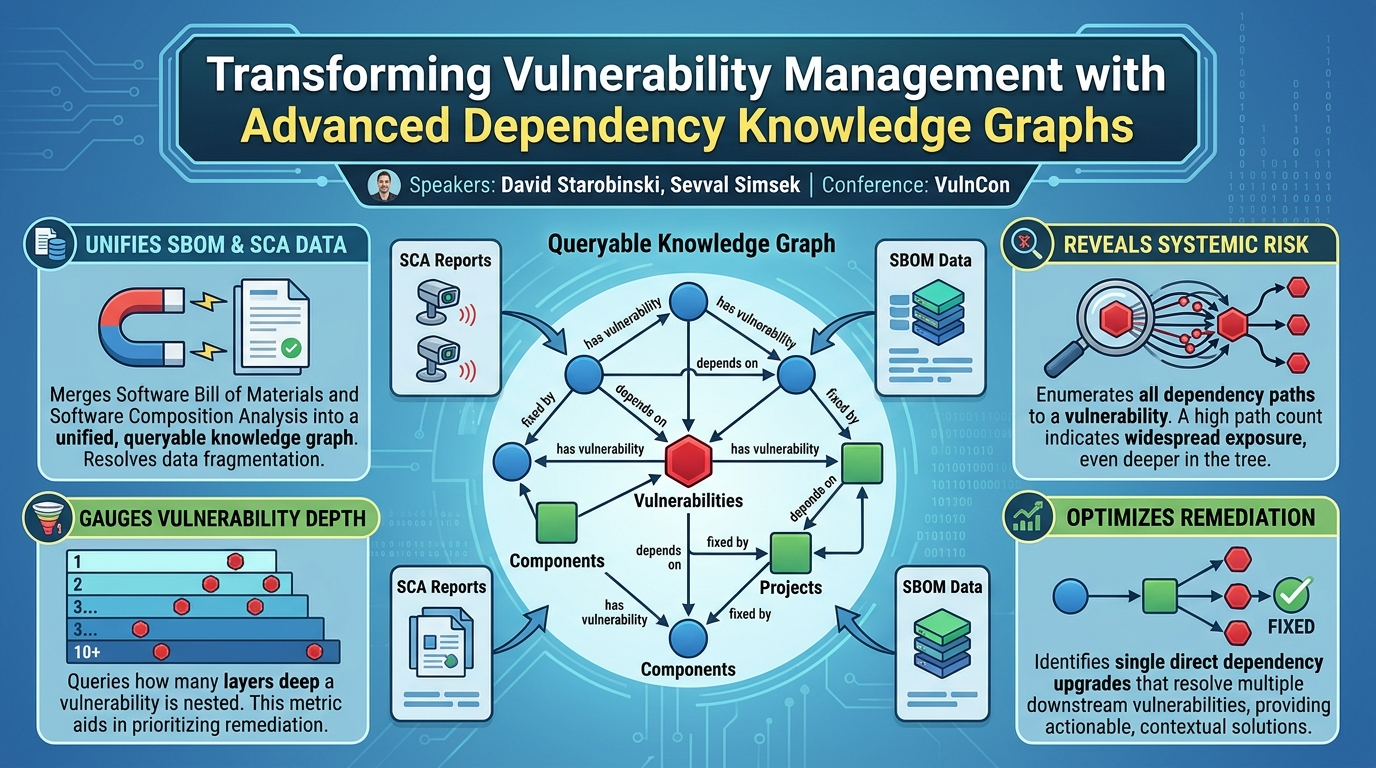
In an era defined by increasingly complex software supply chains, understanding and mitigating vulnerabilities has become a paramount challenge. The talk, "Transforming Vulnerability Management with Advanced Dependency Knowledge Graphs," delivered by David Starobinski and Sevval Simsek from Boston University, introduces a novel methodology to address this complexity. Their work centers on the development of a Vulnerability Dependency Graph (VD-Graph), a unified, queryable knowledge graph that integrates disparate data from Software Bill of Materials (SBOM) and Software Composition Analysis (SCA) tools.
Key moments
- 0:00 Introduction and the 'connect the dots' problem
- 2:00 Software supply chain layers and hidden dependencies
- 6:00 Flink case study: Limitations of current dependency tools
- 10:00 Introducing VD Graph: Unifying dependency and vulnerability data
- 14:00 Query 1: Discovering systemic risk via vulnerability paths
- 17:00 Query 3: Actionable remediation via direct dependency upgrades
- 25:00 Q&A: Handling circular dependencies in the graph
- 29:30 Q&A: Mapping package URLs/CPEs to S-BOM
Transforming Vulnerability Management with Advanced Dependency Knowledge Graphs
Speakers: David Starobinski (Professor, Boston University); Sevval Simsek (PhD Student, Boston University)
Conference: VulnCon
YouTube: https://www.youtube.com/watch?v=4r4ENWFynu8
Overview
In an era defined by increasingly complex software supply chains, understanding and mitigating vulnerabilities has become a paramount challenge. The talk, "Transforming Vulnerability Management with Advanced Dependency Knowledge Graphs," delivered by David Starobinski and Sevval Simsek from Boston University, introduces a novel methodology to address this complexity. Their work centers on the development of a Vulnerability Dependency Graph (VD-Graph), a unified, queryable knowledge graph that integrates disparate data from Software Bill of Materials (SBOM) and Software Composition Analysis (SCA) tools.
The core motivation behind the VD-Graph is to empower developers and security professionals with unprecedented visibility into the intricate web of dependencies and their associated vulnerabilities. Current tools, while useful, often present fragmented information, making it difficult to connect vulnerabilities to their root causes within a project's specific context or to identify actionable remediation strategies. By structuring this information as a comprehensive knowledge graph, Starobinski and Simsek demonstrate how to reveal systemic risks, prioritize patching efforts, and discover optimized remediation paths that were previously unattainable. This research represents a significant contribution, offering a practical and scalable solution to one of the most pressing problems in modern software security.
Background
▶ Watch: Introduction and the 'connect the dots' problem (0:00)
The modern software landscape is characterized by deeply layered and interconnected components, forming what is commonly referred to as the software supply chain. This chain begins with Layer 0, comprising an organization's own source code, configurations, and build scripts. This is followed by Layer 1, which includes directly imported open-source and proprietary libraries, build plugins, and container images (e.g., commons-io, Guava, Spring libraries). The most insidious complexity arises in Layer 2+, where transitive dependencies reside. These are libraries imported by direct dependencies, often hidden from developers' immediate view and not explicitly listed in build scripts. A classic example cited is a project importing commons-io, which in turn might import log4j, thereby exposing the project to the notorious Log4j vulnerability without direct knowledge or control.
This inherent lack of visibility necessitates specialized tools:
- Software Bill of Materials (SBOM) tools (e.g., CycloneDX, SPDX, Trivy, Swift) aim to provide a comprehensive list of all components in a software package, including their versions and transitive dependencies. While they offer crucial dependency visibility, they inherently lack detailed vulnerability information.
- Software Composition Analysis (SCA) tools (e.g., Snyk, Dependabot, OSV Scanner) excel at identifying vulnerabilities within components, often providing details like CVSS scores and suggested mitigation strategies (e.g., "upgrade this version to this version"). However, they frequently fall short in providing a clear, holistic view of how these vulnerable components connect to the main project or in offering actionable, context-aware remediation advice. Often, the suggested upgrades are for transitive dependencies that developers cannot directly control, leading to unpatched issues.
The speakers highlight the limitations of existing approaches with a case study of Apache Flink, a popular Java data streaming library. GitHub's dependency graph, for instance, might list a critical vulnerability in a dependency and suggest upgrading Java XML builder. However, the actual direct dependency might be Apache Hadoop, which transitively pulls in Java XML builder. A developer cannot directly upgrade Java XML builder, rendering the suggestion unactionable and leaving the vulnerability unaddressed. Furthermore, SCA tools often present dependency chains as linear lists, which are difficult to interpret and do not convey the full network of connections or the actual impact of a vulnerability within the project's specific context. This fragmented view makes it difficult to track how vulnerabilities truly connect to the software project, leading to significant challenges in prioritizing and remediating security flaws effectively.
Key Findings
▶ Watch: Flink case study: Limitations of current dependency tools (6:00)
The central contribution of Starobinski and Simsek's work is the successful development and validation of the Vulnerability Dependency Graph (VD-Graph). This novel approach addresses the critical gap in vulnerability management by unifying disparate dependency and vulnerability data into a single, queryable knowledge graph.
Key findings and contributions include:
- Unified Data Representation: The VD-Graph effectively merges SBOM and SCA reports into a coherent graph structure, connecting components to their vulnerabilities and illustrating the full chain of dependencies. This resolves the fragmentation inherent in separate SBOM and SCA outputs.
- Academic Rigor and Practical Performance: The researchers formally proved that the VD-Graph is complete (all relevant data from source documents are included), correct (all facts represented are accurate), and that all nodes are reachable (no isolated components). Beyond theory, practical evaluations demonstrated its efficiency: importing even the largest graphs (e.g., 2,800 nodes and 5,100 relationships) took less than 2 seconds, and all queries executed in under 1 second.
- Discovery of Systemic Risk: The VD-Graph allows for the enumeration of all distinct paths leading to a vulnerable component. This capability reveals the systemic risk of a vulnerability, which goes beyond its CVSS score. For example, the
Commons IOlibrary was found to be reachable by 15 million paths in the Kylin Java project, and a vulnerability in theGo cryptolibrary (version 0.32-33.0) was reachable by 6.8 million paths in certain Go projects. Such high path counts indicate a widespread potential for exploitation, even if the vulnerability is deep within the dependency tree. - Vulnerability Depth Insight: The graph allows for querying the nesting depth of vulnerabilities within the dependency tree. Maven projects, for instance, showed vulnerabilities up to 10 layers deep, while JavaScript and Go projects typically had vulnerabilities 2-3 layers deep. This metric, combined with path count, aids in prioritizing remediation: shallower vulnerabilities with many paths might be easier and more impactful to address.
- Optimized Remediation Strategies: A significant finding is the VD-Graph's ability to identify actionable and optimized remediation steps. By analyzing fixed versions from SCA reports and exploring direct dependency upgrades, the system can recommend a single direct dependency update that resolves multiple downstream vulnerabilities. This capability transcends the limitations of typical SCA tools that often suggest unresolvable transitive dependency upgrades.
- Cross-Language and Platform Applicability: The methodology was tested on over 200 actively maintained open-source Java, JavaScript, and Go projects, demonstrating its versatility across different ecosystems. While Java projects often had a wide range of vulnerabilities (some with over 100), Go projects were surprisingly safer, with 32 out of 50 tested projects having no vulnerabilities at all. However, when Go projects did have vulnerabilities, they were often in core libraries and exhibited high path counts.
These findings highlight the VD-Graph's potential to fundamentally transform vulnerability management by providing unparalleled insight and actionable intelligence, moving beyond fragmented reports to a holistic, context-aware understanding of software supply chain security.
Technical Deep Dive
▶ Watch: Query 1: Discovering systemic risk via vulnerability paths (14:00)
The VD-Graph methodology hinges on the integration and transformation of two primary data sources: SBOMs and SCA reports, into a unified knowledge graph. The choice of a knowledge graph is strategic, as it allows for complex relationships to be modeled and queried effectively, providing context that linear lists or tabular data cannot.
The process begins with data acquisition:
- SBOM Generation: For SBOMs, the researchers utilized CycloneDX plugins tailored for various build systems and package managers, including Maven (for Java), Gradle (for Java), NPM (for JavaScript), and Go. These tools provide a comprehensive list of direct and transitive dependencies, their versions, and their interconnections. The output forms the basis of the SBOM subgraph, which maps the project's root, submodules, and all dependencies, illustrating multiple paths to transitive components and their depths. Crucially, this subgraph does not include vulnerability information.
- SCA Report Generation: For vulnerability data, the OSV scanner was employed, specifically leveraging the OSV database. This choice was made due to its compatibility and ease of integration. SCA tools generate reports detailing identified vulnerabilities, the affected components, and often suggested fixed versions. This data is then used to construct the SCA subgraph, where individual vulnerable components are linked to specific vulnerabilities. This subgraph provides detailed vulnerability information but offers limited insight into the broader dependency network.
The core innovation lies in the VD-Graph construction, where the SBOM subgraph and SCA subgraph are merged. This merge process links components identified in the SBOM with the vulnerabilities reported by SCA tools. The resulting graph is hosted in a Neo4j graph database, chosen for its capabilities as a label property graph. In Neo4j, nodes (representing components, vulnerabilities, projects) and relationships (representing dependencies, "has vulnerability," "fixed by") can have arbitrary properties (e.g., license information, package creator, CVSS score), enriching the data model beyond simple connections.
The VD-Graph's robust design is supported by three academic proofs:
- Completeness: Ensures that every relevant piece of information from the input SBOM and SCA documents is represented in the final graph.
- Correctness: Guarantees that all facts within the graph (e.g., a specific dependency version is vulnerable) accurately reflect the input data.
- Reachability: Confirms that every component node in the graph is connected to the root project, preventing isolated or orphaned data points.
Once constructed, the true power of the VD-Graph is unleashed through graph queries, typically written in Cypher (Neo4j's query language). The researchers presented three key query types:
- Discovering Paths Leading to Vulnerabilities (Q1): This query identifies how many distinct dependency paths lead to a vulnerable component. The Cypher pattern
MATCH (root:Project)-[*]->(vulnerableComponent:Component)-[:HAS_VULNERABILITY]->(v:Vulnerability) RETURN count(DISTINCT path)is used. This directly addresses the systemic risk, as a high number of paths (e.g., 15 million forCommons IOin a Java project, 6.8 million forGo cryptoin a Go project) indicates widespread exposure, regardless of the vulnerability's depth. - Vulnerability Depth (Q2): This query determines how deeply nested a vulnerability is within the dependency tree. The query
MATCH (root:Project)-[r*]->(vulnerableComponent:Component)-[:HAS_VULNERABILITY]->(v:Vulnerability) RETURN length(r)calculates the path length. This insight helps prioritize, as shallower vulnerabilities with many paths might be easier to fix and yield greater security impact. Maven projects, for instance, showed vulnerabilities up to 10 depths, while JavaScript and Go projects typically had vulnerabilities 2-3 steps away from the root. - Vulnerabilities with Fixed Versions (Q3): This practical query identifies vulnerable dependencies for which a fixed version already exists. It connects the fixed versions (often listed in SCA reports) to the affected components. This is crucial for enabling efficient, targeted patching. The system goes a step further by using an external API to analyze newer versions of direct dependencies. For each direct dependency, it evaluates its transitive dependencies in newer versions to determine if the vulnerable component is no longer present or if a fixed version is now imported. This allows the system to suggest a single direct dependency upgrade that can resolve multiple downstream vulnerabilities, significantly optimizing the remediation process. The output can even provide a range of suitable upgrade versions (e.g., "upgrade to version two, three, four, five") to offer flexibility in case of compatibility issues.
During the Q&A, the speakers also elaborated on how the system handles ambiguities and inconsistencies arising from different naming conventions or data reporting between SBOM and SCA tools. They stated a preference for completeness over exactness, meaning they would rather duplicate entries if there's ambiguity than risk missing data. When an SBOM cannot establish a clear dependency link for a vulnerability reported by SCA, the vulnerability is directly connected to the project root, ensuring it's still visible. This allows the tool to identify conflicts, even if their resolution might require manual intervention. The discussion also touched upon package manager support, clarifying that the core graph generation and querying process is standardized once SBOM and SCA reports are produced, with differences primarily in the initial build requirements for SBOM generation across various ecosystems (e.g., Go often doesn't require a full build). Node matching relies on PURL (Package URL) and extracting package name and version for unification.
Demo / Proof of Concept
▶ Watch: Query 3: Actionable remediation via direct dependency upgrades (17:00)
While the talk did not feature a live, interactive demo in the traditional sense, the speakers presented compelling evidence of the VD-Graph's capabilities through practical evaluations and illustrative outputs from their command-line tool. This effectively served as a proof of concept, demonstrating the actionable insights derived from querying the knowledge graph.
The core of the "demo" involved showcasing how the VD-Graph addresses the limitations of existing tools by providing clear, actionable remediation advice. An example output from their command-line interface was presented, illustrating a scenario where a direct dependency (date format) was implicated in a vulnerability originating from a transitive dependency (trim new lines). The tool's output went beyond merely identifying the vulnerable component; it listed all detected vulnerabilities connected to that direct dependency and, crucially, provided an optimized upgrade path.
For instance, if the direct dependency was at version 1.0.12, the tool might suggest upgrading to versions two, three, four, five. This range of suggested versions is a key differentiator, as it offers flexibility to developers who might face compatibility issues with the latest version but could still mitigate the vulnerability by upgrading to an intermediate, safer version. This direct, actionable output contrasts sharply with the often unresolvable suggestions from traditional SCA tools, which might tell a developer to upgrade a transitive dependency they don't directly control.
Furthermore, the Flink case study, though presented as a problem statement, implicitly serves as a conceptual demonstration of what the VD-Graph rectifies. The problem of GitHub's dependency graph suggesting an upgrade for Java XML builder when the direct dependency is Apache Hadoop highlights the exact scenario where the VD-Graph's ability to map direct dependencies to their vulnerable transitive children, and then identify a direct dependency upgrade, becomes invaluable.
The practical evaluation phase, where the system was tested against over 200 open-source projects, further cemented the proof of concept. The ability to handle large-scale projects with thousands of nodes and relationships, perform imports in seconds, and execute complex queries in under a second, underscores the system's efficiency and scalability. This collective evidence demonstrates that the VD-Graph is not merely a theoretical construct but a robust, practical tool capable of delivering significant value in real-world vulnerability management scenarios.
Defensive Implications
▶ Watch: Q&A: Mapping package URLs/CPEs to S-BOM (29:30)
The VD-Graph offers several profound implications for how organizations approach defensive security and vulnerability management:
- Holistic Visibility and Contextual Understanding: Defenders gain a complete, contextual view of their software supply chain, moving beyond isolated vulnerability reports. They can now see how every component, direct or transitive, connects to the root project and precisely how vulnerabilities are introduced. This helps identify critical choke points and deeply embedded risks.
- Intelligent Prioritization of Remediation: Instead of relying solely on CVSS scores, security teams can leverage the VD-Graph's insights into path count and vulnerability depth. Vulnerabilities with high path counts, even if deeply nested, indicate a widespread attack surface and high systemic risk, demanding immediate attention. Conversely, shallow vulnerabilities with many paths might be easier to fix for maximum impact. This data-driven prioritization allows for more efficient allocation of limited security resources.
- Optimized and Actionable Remediation Strategies: The VD-Graph's ability to identify direct dependency upgrades that resolve multiple downstream vulnerabilities is a game-changer. This capability helps security teams and developers avoid the "whack-a-mole" approach, reducing the effort and potential for introducing new bugs associated with multiple, fragmented patches. It provides concrete, actionable recommendations that developers can implement directly.
- Proactive Risk Assessment: The queryable nature of the graph allows defenders to proactively assess the risk profile of specific components or versions. Before integrating a new library, they could query the graph to understand its potential transitive vulnerabilities and how it might impact their project's overall security posture.
- Improved Collaboration Between Security and Development: By providing clear, visual, and actionable insights, the VD-Graph can bridge the communication gap between security teams and developers. Developers receive specific, implementable upgrade paths, while security teams gain a deeper understanding of the development context and the feasibility of remediation efforts.
- Enhanced Supply Chain Security Posture: By systematically identifying and addressing vulnerabilities across the entire dependency tree, organizations can significantly strengthen their overall software supply chain security. This goes beyond mere compliance, enabling a more resilient and secure development lifecycle.
- Extensibility for Future Threats: The graph database architecture is inherently flexible. As new types of vulnerabilities emerge or new security metrics become relevant, the VD-Graph can be extended with new node properties or relationship types, ensuring its continued utility in an evolving threat landscape.
Key Takeaways
- Software supply chain complexity demands a unified approach: Fragmented data from SBOMs and SCA tools leaves critical gaps in understanding and addressing vulnerabilities, particularly those in hidden transitive dependencies.
- VD-Graph unifies dependency and vulnerability data: By merging SBOM and SCA reports into a queryable knowledge graph (Neo4j), the VD-Graph provides a holistic, contextual view of software supply chain security.
- Path count and vulnerability depth reveal true systemic risk: Beyond CVSS scores, the number of distinct paths to a vulnerability and its nesting depth are crucial metrics for prioritizing remediation efforts and understanding potential exploitation impact.
- Optimized remediation is now actionable: The VD-Graph can identify direct dependency upgrades that resolve multiple downstream vulnerabilities, offering concrete, version-range-based suggestions that streamline patching and reduce developer burden.
- Scalable and practical for real-world projects: The system demonstrates high performance, handling large projects with thousands of nodes and relationships, and executing queries in sub-second times, proving its readiness for practical adoption.
- Empowers defenders with unprecedented insights: Security teams and developers gain enhanced visibility, enabling data-driven prioritization, proactive risk assessment, and improved collaboration for a stronger defensive posture.
About the Speaker(s)
David Starobinski is a Professor at Boston University. His expertise lies in areas that contribute to understanding and securing complex systems, providing the academic foundation for the VD-Graph project.
Sevval Simsek is a PhD Student at Boston University and the primary architect behind the VD-Graph methodology, which constitutes a major portion of her PhD thesis. She is expected to graduate soon and is currently on the job market. Her work demonstrates a deep understanding of software supply chain security challenges and innovative solutions.
Reviews
Dr. Zero (Offensive Security Researcher) — SOLID
Competent academic work on a real problem — dependency graphs for vuln management — but the novelty is incremental. Graph databases + SBOMs + SCA isn't new; the contribution is making it work cleanly and proving completeness/correctness. Useful for practitioners who haven't built this themselves, but won't shift how the field thinks.
Heather Calloway (CISO) — SOLID
Solid academic work addressing a real operational problem — the gap between SBOM inventories and SCA vulnerability reports. The graph-based approach to transitive dependency analysis is sound, but this is still a research prototype, not a production tool. Worth tracking if you're running a mature vulnerability management program and frustrated with your current tooling's inability to surface actionable remediation paths.
→ Top-rated talks at CVE/FIRST VulnCon 2026 & Annual CNA Summit