Your Priors Are Out To Get You*: Security and Statistics (* P=0.06)
Kate (Head of Security · TradeMe), Lucy (Co-president · New Zealand Association of Scientists)
Christchurch Hacker Conference 2025 · Main Stage
Overview
In their CHCon talk, "Your Priors Are Out To Get You: Security and Statistics ( P=0.06)," Kate, Head of Security at TradeMe, and Lucy, Co-president of the New Zealand Association of Scientists, deliver a compelling and often humorous exposé on the misapplication of statistics in the security industry. Drawing on their diverse backgrounds—Kate as a seasoned security professional and Lucy as an environmental microbiologist and statistician—they dissect common pitfalls, highlight critical considerations, and ultimately guide security practitioners on when not to use statistics. Their core message challenges the often-unquestioned reliance on numerical metrics, urging a more nuanced and context-aware approach to data-driven decision-making in security.
Key moments
- 1:50 Introduction: Security and statistics pitfalls
- 6:30 If you have all relevant data, no statistics needed
- 16:00 False positives: Drowning in security alert noise
- 20:00 Attack prevalence dramatically impacts test usefulness
- 26:00 The goose analogy: Prioritizing your security problems
- 34:10 Generic vs. targeted security indicators and layering
- 44:00 Data informs, but humans make the decisions
Your Priors Are Out To Get You*: Security and Statistics (* P=0.06)
Speakers: Kate (Head of Security, TradeMe); Lucy (Co-president, New Zealand Association of Scientists)
Conference: CHCon
YouTube: https://www.youtube.com/watch?v=1XZD5UGYrTo
Overview
In their CHCon talk, "Your Priors Are Out To Get You*: Security and Statistics ( P=0.06)," Kate, Head of Security at TradeMe, and Lucy, Co-president of the New Zealand Association of Scientists, deliver a compelling and often humorous exposé on the misapplication of statistics in the security industry. Drawing on their diverse backgrounds—Kate as a seasoned security professional and Lucy as an environmental microbiologist and statistician—they dissect common pitfalls, highlight critical considerations, and ultimately guide security practitioners on when not* to use statistics. Their core message challenges the often-unquestioned reliance on numerical metrics, urging a more nuanced and context-aware approach to data-driven decision-making in security.
The talk serves as a vital wake-up call for security professionals who often grapple with vast amounts of noisy data and the pressure to derive actionable insights. Kate and Lucy meticulously demonstrate how a lack of understanding of statistical fundamentals, coupled with the unique characteristics of security data (e.g., extremely low prevalence of actual attacks), can lead to flawed alerts, alert fatigue, and misallocated resources. By emphasizing the importance of prior probability, data quality, and the distinction between mere data visualization and true statistical inference, they provide a powerful framework for more effective and responsible security analysis.
Ultimately, this presentation is crucial for anyone involved in security operations, threat detection, or risk management. It equips attendees with the critical thinking skills necessary to interrogate security metrics, design more effective detection strategies, and make better-informed decisions that account for the real-world complexities and inherent biases within their data. It's a reminder that numbers, while powerful, are only approximations of reality and must be interpreted with a deep understanding of their context and limitations.
Background
▶ Watch: Introduction: Security and statistics pitfalls (1:50)
The pervasive need for data-driven decision-making in cybersecurity often leads practitioners down a path where statistics are applied without a full appreciation of their underlying principles or the unique characteristics of security data. This problem is exacerbated by the sheer volume and inherent "noisiness" of security logs, where the vast majority of events represent legitimate user activity, and actual attacks are rare occurrences. This creates a significant challenge for detection engineers and security analysts who are tasked with sifting through mountains of benign data to find the proverbial needle in a haystack.
Kate and Lucy illustrate this problem by distinguishing between data visualization and true statistics. Many security dashboards, while visually informative, simply display known values over time (e.g., minimum wage vs. PhD stipend values over years). This is not statistics because the values are precisely known, and no inference about a larger population is required. True statistics, as exemplified by Lucy's PhD research graphs, involve error bars and inferences drawn from samples of a larger, often messy, population where individual data points are not exact. This fundamental distinction is frequently overlooked, leading to an overconfidence in visualized trends without understanding the underlying uncertainty.
Furthermore, the speakers highlight how the "field of view" or context dramatically changes how data should be interpreted. Security professionals often operate with incomplete knowledge, falling into categories of "known knowns," "known unknowns," and critically, "unknown unknowns." When analyzing login attempts, for instance, security teams might have high confidence in total accepted logins but significantly less confidence in identifying legitimate users who were wrongly rejected, or, most critically, malicious actors who were wrongly accepted. This inherent asymmetry in data visibility—where successful attacks often go unreported by the victim and unknown to the defender—creates a challenging environment for accurate statistical analysis. The core issue is that security data is often heavily skewed; the world is "not all bad," and the overwhelming majority of log events are not attacks, making traditional statistical approaches designed for more balanced populations highly problematic.
Key Findings
▶ Watch: False positives: Drowning in security alert noise (16:00)
The talk articulates several critical findings that challenge conventional wisdom in security measurement and analysis:
- Statistics are for Incomplete Data: A foundational insight is that if you possess 100% of the relevant data, you do not need statistics. Statistics are tools for inferring information from samples when a complete dataset is unavailable or impractical to collect. The simple card game demonstration effectively illustrates this: Lucy, holding the card, knows its identity with 100% certainty, while Kate uses statistical inference (narrowing probabilities based on questions) to deduce it.
- The Overwhelming Impact of False Positives: In security operations, false positives are often a more significant threat than false negatives. Given that actual attacks represent a minuscule fraction of all logged events (e.g., 1 in 30 billion log events at TradeMe), even a highly sensitive test with a seemingly low false positive rate (e.g., 1 in 10,000) can generate an unmanageable volume of erroneous alerts. This "noise" leads to alert fatigue, desensitization, and ultimately, missed real threats. The speakers assert that for high-volume environments, false positive rates often need to be as low as 1 in a million or even lower to be useful in isolation.
- Prevalence is Paramount (Your Priors Matter): The prevalence of the event you are trying to detect fundamentally dictates the utility of any statistical test. If only one in a million events is truly malicious, a test with 90% sensitivity (correctly identifying bad things) but a 1 in 10,000 false positive rate will still yield a million false positives for every thousand true positives in a dataset of a billion events. This highlights the critical role of prior probability – the existing knowledge or assumption about how likely an event is before running a test. Ignoring priors leads to wildly inaccurate conclusions and wasted effort.
- Correlation Does Not Equal Causation: Drawing on biological examples, the talk demonstrates that observed correlations (e.g., increasing average human height over the 20th century) do not necessarily imply direct causation. Understanding the underlying mechanisms (e.g., improved nutrition and healthcare for height) is crucial. In security, this means understanding the true relationship between a measured data point and the actual security event you care about, rather than mistaking a proxy for a direct indicator.
- Risk Registers Are Often Based on "Vibes": The common practice of assigning precise probabilities and impacts to risks in security risk registers is often flawed, relying more on intuition ("vibes") than rigorous statistical backing. Furthermore, not all risks are worth managing; focusing on events with extremely low probability (e.g., 15 cosmic rays hitting a specific memory bank) or unmanageable scale (e.g., nuclear war) diverts resources from actionable problems. Effective risk management focuses on problems where influence over probability or impact is genuinely possible.
- Decisions Are Human, Not Just Data-Driven: While data and statistics are valuable tools, they do not make decisions. Humans, influenced by their values, priorities, available responses, and the specific questions they are asking, make decisions. Numbers are approximations, and their value must be weighed against costs, trade-offs, and the broader organizational context.
Technical Deep Dive
▶ Watch: Attack prevalence dramatically impacts test usefulness (20:00)
The talk delves into several core statistical and security concepts, providing a robust technical foundation for its arguments.
Statistical Fundamentals
- Data Visualization vs. Statistical Inference: The speakers draw a clear line. Data visualization (e.g., a graph showing minimum wage vs. PhD stipend over time) presents known, precise values. Statistical inference, however, is performed when dealing with samples from a larger population, where individual data points have inherent uncertainty, represented by error bars. Lucy's PhD data with error bars exemplifies this, where statistical tests are necessary to determine the probability that observed differences between groups are real, rather than due to sampling variability.
- Sensitivity and Specificity: These are critical metrics for evaluating any detection system.
- Sensitivity (True Positive Rate): Given a bad thing, what is the chance this test will correctly identify it as bad? This is often what security teams optimize for initially, aiming to "catch everything."
- Specificity (True Negative Rate): Given a good thing, what is the chance this test will correctly identify it as good? Conversely, the false positive rate is 1 - specificity. The challenge in security is that maximizing sensitivity often drastically reduces specificity, leading to excessive false positives.
- Distributions and Overlap: Statistical tests often assume a normal distribution (bell curve) of data. However, real-world security data may not follow this. More importantly, when comparing populations (e.g., attackers vs. legitimate users), there's often significant overlap in their behaviors. Using the example of height distribution in men and women, the speakers illustrate that while groups may have different averages, an individual's data point within the overlapping region cannot definitively assign them to one group or another. This overlap makes distinguishing attackers from legitimate users based on single metrics extremely difficult.
- The Null Hypothesis and P-Values: In scientific inquiry, the null hypothesis is the default assumption that there is no effect or no difference (e.g., "the house is not haunted"). Statistical tests then aim to find evidence against this null hypothesis. The P-value quantifies the probability of observing data as extreme as, or more extreme than, what was observed, assuming the null hypothesis is true. A commonly accepted threshold is P < 0.05, meaning there's less than a 5% chance of a false positive (incorrectly rejecting the null hypothesis). The talk's title, "P=0.06," subtly implies that the evidence for their claims is just shy of this conventional threshold for statistical significance, adding a layer of self-aware humor.
- Regression Analysis: This statistical method involves looking back at historical data to determine if a proposed test or model would have accurately identified past events or predicted outcomes. In a security context, it means asking: "If we had implemented this alert historically, would it have found what we wanted, or would it have drowned us in noise by locking out all legitimate users?" This is crucial for validating the real-world utility of a detection mechanism.
Security Applications
- Logging and Confidence: The analysis of login attempts highlights varying degrees of confidence in different security data points. While total attempts and successful logins might be well-understood, confidence decreases significantly for rejected legitimate users (who will complain loudly) and, most critically, accepted malicious users (who will not complain). This inherent bias in observable data makes accurate assessment challenging.
- Prevalence in Security Data: The speakers emphasize that the population of "bad events" is orders of magnitude smaller than "good events." Kate's experience at TradeMe, with 30-50 billion log events a month, underscores this: if only 1 in a million events is malicious, a test with a 1 in 10,000 false positive rate would still generate 3-5 million false alarms per month. This context is vital for setting realistic expectations for alert thresholds.
- Generic vs. Targeted Indicators:
- Generic Indicators: These are general symptoms of suspicious activity (e.g., password recently changed, new login from an unknown IP, elevated privileges, fast movement through a network). They are broad, often publicly understood, and useful for initial screening but tend to be very noisy because legitimate users also exhibit "weird things." They can catch unknown attacks.
- Targeted Indicators: These point to a very specific problem (e.g., a customer complaint about a particular type of fraud). They are less noisy and highly effective for their specific purpose but are fragile, lack a "halo effect" (won't catch other attack types), and attackers can adapt to them.
- Layering Security Tests: A key defensive strategy is to layer multiple imperfect tests. While a single test might have a high false positive rate, the probability of multiple independent tests all firing falsely for the same benign event drops dramatically. For example, two tests, each with a 50% chance of being wrong, when combined, only have a 25% chance of both being wrong. This layering is essential for reducing noise and increasing confidence in alerts.
- The "Sus" Filter: For scenarios where hyper-targeted alerts are impossible, the speakers advocate for an initial "does this look sus?" screening. This qualitative, experience-driven filter can reduce the data pool by a factor of 100 to 1,000, significantly mitigating the impact of false positives before applying more specific tests. This acknowledges that human intuition, informed by experience and understanding of the environment, plays a crucial role in initial triage.
Demo / Proof of Concept
▶ Watch: Generic vs. targeted security indicators and layering (34:10)
The talk features a conceptual demonstration rather than a software-based proof of concept or exploit. The "demo" is a card game played live by Kate and Lucy, designed to illustrate the fundamental difference between having 100% of the relevant data and requiring statistical inference.
In this interactive segment (02:00-06:00), Lucy picks a card and looks at it, giving her complete knowledge. Kate, who does not know the card, uses a series of questions to narrow down the possibilities based on probabilities. By asking "Is it red?" (50% chance), "Is it a spade?" (25% chance of the remaining), and then using binary search-like questions about its rank (e.g., "Is it bigger than six?"), Kate demonstrates how she can deduce the card's identity (the 10 of Spades) by iteratively refining probabilities as more information is gathered.
The core point of this demonstration is to highlight that while Kate used an efficient statistical approach (fewer than 52 questions), Lucy, with 100% data, needed no statistics at all. This simple, relatable example powerfully underpins the talk's central argument: if you have complete, accurate data, statistical methods are unnecessary, and attempting to apply them can complicate or obscure clear facts. It also subtly introduces the idea that even with statistical methods, data quality is paramount, as Lucy could have lied about her card, rendering Kate's statistical inferences incoherent.
Defensive Implications
▶ Watch: Data informs, but humans make the decisions (44:00)
The insights from this talk have profound implications for defensive security strategies, urging practitioners to rethink their approach to data, metrics, and decision-making:
- Interrogate Your Metrics and Data Sources: Do not blindly trust numbers presented in dashboards or vendor reports. Always ask: "Where did this number come from? What question is it trying to answer? What are its limitations and underlying assumptions?" Challenge the notion that a percentage on a risk register is anything more than a "vibe" unless it's backed by rigorous, context-aware analysis.
- Prioritize False Positive Reduction: In environments with high data volumes and low attack prevalence, false positives are the primary enemy. Focus on tuning detection rules and layering controls to dramatically reduce noise. Aim for false positive rates in the order of 1 in a million for individual alerts in high-volume systems. Recognize that a test that catches everything but also generates millions of false alarms is effectively useless.
- Understand Your Data's Distribution and Priors: Before applying any statistical test or setting alert thresholds, understand the prior probability of an attack within your specific environment and the distribution of both normal and malicious behaviors. Do not assume normal distributions; if your data is heavily skewed, adjust your analytical approach accordingly.
- Embrace Layered Defenses: No single security control or detection rule is perfect. Implement a strategy of layered security, where multiple, independent tests are combined. The cumulative accuracy of layered, imperfect controls is significantly higher than any single control, dramatically reducing the chance of a false positive making it through multiple stages.
- Use Generic and Targeted Indicators Strategically: Leverage generic indicators (e.g., new IP, password change) as an initial "sus" filter to reduce the overall data pool. Once a smaller, suspicious subset is identified, apply more targeted indicators to confirm the presence of a specific threat. This two-stage approach helps manage noise effectively.
- Validate Detection Rules with Historical Data: Before deploying new detection rules, perform regression analysis against historical logs. This helps ensure that the rule would have caught past known attacks without generating an unmanageable number of false positives or locking out legitimate users. Understand what "not bad" looks like in your environment, not just what "bad" looks like.
- Focus on Manageable Risks: Re-evaluate your risk register. Concentrate defensive efforts on risks where you can realistically influence the probability or impact. Avoid expending resources on events that are either vanishingly unlikely (e.g., cosmic ray attacks) or so catastrophic and broad that they become collective action problems beyond your organization's scope (e.g., nuclear war). Identify the "angry geese under your bed" – the specific, actionable threats relevant to your context.
- Recognize the Human Element in Decision-Making: Data and statistics are tools to inform decisions, not make them autonomously. Security professionals must integrate numerical insights with their professional judgment, understanding of the organization's values, available resources, and strategic priorities. Be prepared to communicate the limitations and context of your data to stakeholders, especially executives, who often prioritize "why" over "how the math works."
Key Takeaways
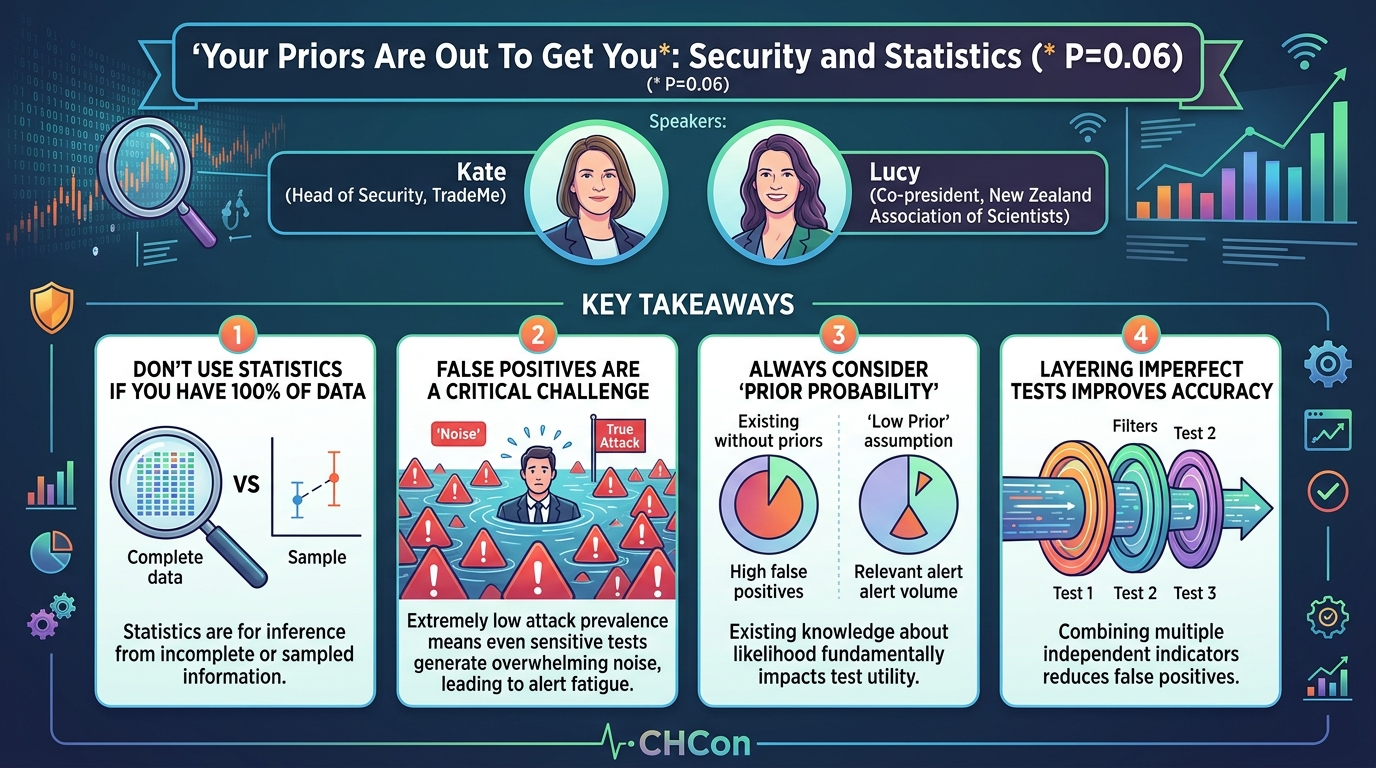
- Don't use statistics if you have 100% of the relevant data. Statistics are for inference from incomplete or sampled information.
- False positives are the most critical challenge in security detection. Due to the extremely low prevalence of actual attacks, even highly sensitive tests can generate overwhelming noise, leading to alert fatigue and missed threats.
- Always consider the "prior probability" and data distribution. Your existing knowledge about the likelihood of an event and how your data is distributed fundamentally impacts the utility and accuracy of any statistical test.
- Layering imperfect security tests dramatically improves accuracy and reduces false positives. Combining multiple independent indicators is a robust strategy for confident detection.
- Numbers are approximations, not absolute reality. Always question the source, context, and underlying assumptions of any security metric; data informs, but human judgment and values drive decisions.
- Focus on manageable risks within your sphere of influence. Prioritize problems where your actions can realistically impact probability or impact, rather than expending resources on unmanageable or irrelevant threats.
About the Speaker(s)
Kate is the Head of Security at TradeMe, a prominent New Zealand online auction and classifieds website. With a background as a "recovered pentester," she brings extensive practical experience in identifying and exploiting security vulnerabilities. Kate is a seasoned security conference speaker, having presented on various topics, particularly network protocol abuses. She also humorously notes her rumored involvement in creating a government-approved tabletop RPG. Kate's insights are deeply rooted in real-world security operations and practical threat detection.
Lucy is an environmental microbiologist and currently serves as the Co-president of the New Zealand Association of Scientists. She is also a union organizer with the Public Service Association (PSA). Lucy's unique perspective, grounded in rigorous scientific methodology and statistical analysis from her academic background, offers a critical lens through which to evaluate security practices. She occasionally speaks at security conferences "just to keep her life interesting," highlighting her passion for interdisciplinary knowledge sharing. Kate and Lucy notably gave the first-ever talk at CHCon in 2016, returning nine years later to share further insights.
Reviews
Dr. Zero (Offensive Security Researcher) — STRONG ACCEPT
A genuinely useful talk that teaches security practitioners what most of them badly need to learn: why their detection math is broken. Kate and Lucy nail the core insight—prevalence destroys your fancy 99% accurate test when attacks are 1-in-a-billion—and deliver it with enough wit to keep a con audience engaged. Not novel to statisticians, but novel to most SOC engineers, and that's the audience that matters here.
Heather Calloway (CISO) — STRONG ACCEPT
This is the talk I'd send to every detection engineering lead and SOC manager before they build their next alert. It won't reshape your security program, but it will stop you from wasting six months on a detection rule that drowns your team in noise. The statistical literacy here is practical, not academic.