Beyond Static: Augmenting Static Analysis with Dynamic Traces and Statistical Insights
John Cipriati (Cyber Engineer · Zetier), Joe Dussault (Cyber Engineer · Zetier)
DistrictCon 2026 (Year 1) · Day 1 · Disco In The Dark
Overview
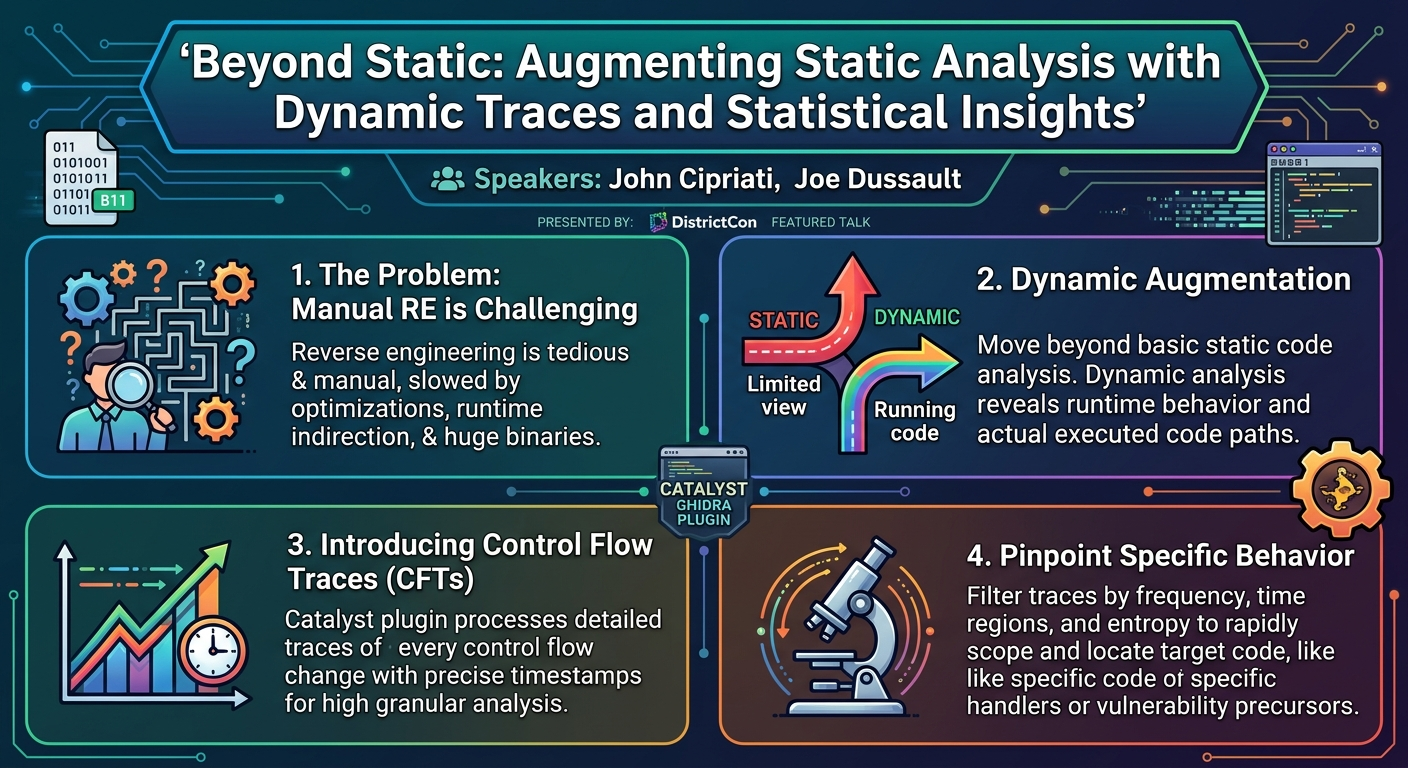
In the realm of cybersecurity, reverse engineering (RE) remains a critical yet profoundly challenging discipline. The process is inherently tedious and manual, often hampered by factors such as extreme compiler optimizations, pervasive runtime indirection, and the sheer size of modern binaries. These complexities can drastically slow down an engineer's workflow, impeding efforts to understand a binary's inner workings, identify vulnerabilities, or analyze malicious code. This talk, "Beyond Static: Augmenting Static Analysis with Dynamic Traces and Statistical Insights," presented by John Cipriati and Joe Dussault from Zetier, directly addresses these pain points.
Key moments
- 0:00 Introduction: The tedious nature of reverse engineering
- 2:15 Static analysis limits and leveraging dynamic code coverage
- 4:20 Augmenting code coverage with control flow traces and timestamps
- 5:15 Catalyst use cases: unbalanced ref counts and code complexity
- 7:15 Live Demo: Setting up Mongoose web server for tracing
- 11:00 Live Demo: Filtering Catalyst heat map to find firmware upload
- 12:40 Future work: Improving Catalyst performance and analysis capabilities
- 15:00 Q&A: Differential analysis and handling multiple trace runs
Beyond Static: Augmenting Static Analysis with Dynamic Traces and Statistical Insights
Speakers: John Cipriati (Cyber Engineer, Zetier), Joe Dussault (Cyber Engineer, Zetier)
Conference: DistrictCon
YouTube: https://www.youtube.com/watch?v=T4Yqy8JGh8g
Overview
In the realm of cybersecurity, reverse engineering (RE) remains a critical yet profoundly challenging discipline. The process is inherently tedious and manual, often hampered by factors such as extreme compiler optimizations, pervasive runtime indirection, and the sheer size of modern binaries. These complexities can drastically slow down an engineer's workflow, impeding efforts to understand a binary's inner workings, identify vulnerabilities, or analyze malicious code. This talk, "Beyond Static: Augmenting Static Analysis with Dynamic Traces and Statistical Insights," presented by John Cipriati and Joe Dussault from Zetier, directly addresses these pain points.
The core of their presentation revolves around enhancing traditional static analysis with robust dynamic tracing and statistical insights, culminating in the development of their Catalyst Ghidra plugin. Catalyst aims to streamline the reverse engineering process by making analysis more efficient and targeted. By moving beyond simple code coverage to capture detailed, timestamped control flow traces, and then applying statistical filtering and visualization techniques, the speakers demonstrate a powerful methodology for rapidly pinpointing relevant code paths within complex binaries. This approach significantly reduces the time and effort required to navigate vast codebases, allowing engineers to focus on specific areas pertinent to their investigative goals.
Background
▶ Watch: Introduction: The tedious nature of reverse engineering (0:00)
Reverse engineering, as highlighted by Cipriati and Dussault, is fundamentally a labor-intensive endeavor. Modern software development practices, including aggressive compiler optimizations, the extensive use of runtime indirection (e.g., virtual functions, function pointers), and the ever-increasing size of binaries, exacerbate this challenge. For an engineer attempting to understand a program's behavior or discover vulnerabilities, these obstacles can render the task daunting, if not impossible, without significant time investment. The imperative, therefore, is to accelerate and refine the analysis process, enabling quicker insights and more agile operational responses.
Traditional approaches to scoping reverse engineering efforts often involve static analysis techniques. Engineers might search for specific strings (e.g., error messages), leverage symbols if available, examine imports and exports to understand external dependencies, or look at Memory-Mapped I/O (MMIO) addresses in embedded systems. While valuable, static analysis inherently limits understanding to what is visible in the disassembled binary. It struggles to reveal dynamic runtime behavior, such as which code paths are actually executed under specific conditions, how data flows, or the precise targets of indirect jumps and calls.
To overcome these limitations, dynamic analysis becomes indispensable. Tools like debuggers offer granular introspection, allowing step-by-step code execution. Sanitizers (e.g., ASan, UBSan) detect memory corruption and other runtime errors. Fuzzing explores inputs that trigger unexpected behavior or crashes. Among these, code coverage is particularly powerful. It layers information about executed basic blocks onto the static disassembly, indicating which parts of the code were touched during a specific execution. Existing tools such as Cartographer for Ghidra, and Tenet and Lighthouse for IDA Pro and Binary Ninja, provide excellent capabilities for visualizing code coverage.
However, a significant practical challenge with standard code coverage is its potential for noise. In many real-world scenarios, running a binary to generate a trace will inevitably execute large amounts of code irrelevant to the specific analysis goal. This "noise" can obscure relevant execution paths, making it difficult to interpret the results unless execution conditions are meticulously controlled. Cipriati and Dussault's work directly addresses this by proposing an augmentation: the control flow trace (CFT). Unlike typical code coverage, which merely records a set of executed basic blocks, a CFT maintains a complete, ordered record of every change to the program's control flow. By incorporating timestamps with each control flow change, this approach adds a crucial layer of granularity, making it far easier to isolate and understand specific behavioral sequences within the static disassembly. This forms the foundational principle behind their Catalyst plugin.
Key Findings
▶ Watch: Augmenting code coverage with control flow traces and timestamps (4:20)
The central contribution of this talk is the introduction and demonstration of Catalyst, a Ghidra plugin designed to augment static analysis with dynamic traces and statistical insights. Catalyst provides a sophisticated visualization and filtering framework for control flow traces, effectively transforming raw execution data into actionable intelligence for reverse engineers. The key findings and capabilities presented include:
- Enhanced Trace Granularity: Catalyst moves beyond basic code coverage by processing control flow traces that record every single change in execution flow, complete with precise timestamps. This allows for a much more detailed understanding of program execution over time, enabling engineers to discern specific sequences of events rather than just a set of executed blocks.
- Statistical Visualization: The plugin integrates statistical analysis directly into the Ghidra interface. It visualizes trace data through a heatmap, which graphically represents activity over time, and a filterable table of basic blocks. This combination allows users to quickly identify "hot spots" of activity and narrow down the scope of their investigation.
- Ref Count Balancing Analysis: Catalyst can be used to analyze the frequency of calls to reference counter (
getandput) functions. By comparing these frequencies, engineers can detect unbalanced ref counts, which are often precursors to use-after-free vulnerabilities. The talk highlighted a scenario where traditional methods might miss a potential use-after-free because an object was never explicitly freed, but Catalyst could reveal the imbalance in increment/decrement operations.
- Code Complexity and Bug Discovery using Entropy: A novel application of Catalyst is its ability to measure the entropy of branch targets from basic blocks. In compiled binaries, compiler optimizations often inflate traditional cyclomatic complexity metrics, making it difficult to identify genuinely complex—and thus potentially bug-prone—code. By analyzing the variability of execution paths taken from a given block during dynamic execution, Catalyst provides a more accurate indicator of complexity. High entropy suggests code that is harder to reason about and therefore more likely to contain bugs.
- Resolution of Indirect Jumps and Calls: For languages like C, where indirect jumps and calls (e.g., via function pointers) are common and lack the explicit vtable structures found in C++, statically resolving all possible targets can be challenging. Catalyst's "next blocks" feature, leveraging the complete record of taken branches, allows engineers to easily see all basic blocks that were jumped or called to from a given instruction, even without static offsets. This significantly aids in understanding complex control flow.
Technical Deep Dive
▶ Watch: Live Demo: Setting up Mongoose web server for tracing (7:15)
Catalyst is implemented as a plugin for Ghidra, a powerful open-source reverse engineering framework. Its core functionality revolves around processing and visualizing control flow traces, which differ fundamentally from standard code coverage. Instead of merely logging which basic blocks were executed, Catalyst's traces capture an ordered sequence of every control flow change, such as jumps, calls, and returns, along with associated timestamps. This temporal granularity is crucial for understanding the dynamic behavior of a program.
The trace data itself is acquired using a tracing engine. For the demonstration, the speakers utilized DynamoRIO, a dynamic binary instrumentation framework capable of monitoring and modifying the execution of programs. The output from DynamoRIO is then converted into a custom Cbor file format. Cbor (Concise Binary Object Representation) is a binary data serialization format similar to JSON but more compact, making it suitable for large trace files. The trace data recorded for Catalyst includes:
- A timestamp, typically sourced from a separate "time keeper" thread to ensure accuracy.
- The memory address of each executed basic block.
- A list of all modules loaded in the binary at the time of execution, along with their memory addresses, to correctly map basic blocks to their respective loaded images.
Within Ghidra, Catalyst presents this data through two primary interfaces:
- Heatmap: This visual component displays program activity over the entire trace duration. "Hot spots" on the heatmap indicate periods of intense code execution, allowing engineers to quickly identify phases of program activity (e.g., initialization, user interaction, specific event handling).
- Filterable Table: This table lists all executed basic blocks, providing details such as their address, module, execution frequency, and calculated entropy. Users can filter this table based on various criteria, including whether the block is internal or external to the target binary, its execution count, or its location within a specific time region selected on the heatmap.
One of Catalyst's innovative analytical features is the calculation of entropy for basic blocks. This metric is used to quantify the variability of control flow paths originating from a given block. For instance, a basic block with multiple conditional branches that are frequently taken in different directions would exhibit higher entropy than a block whose branches consistently lead to the same target. High entropy can indicate complex logic, potentially highlighting areas where bugs are more likely to reside, especially in heavily optimized compiled code where traditional static complexity metrics might be misleading.
The "next blocks" feature leverages the comprehensive nature of the control flow trace to provide context for indirect control flow. When an indirect jump or call instruction is encountered, static analysis often struggles to resolve all possible targets without additional runtime information or symbolic data. Because Catalyst records every branch taken, it can retrospectively show all the concrete target basic blocks that were reached from a given indirect instruction during the traced execution, even if there are no explicit vtables or static offsets.
Despite its powerful capabilities, the speakers acknowledge several areas for future improvement. A major limitation is the current implementation of trace analysis directly within the Ghidra plugin using Java. This approach leads to significant performance bottlenecks and memory consumption. For example, an 8GB trace file was observed to consume over 40GB of RAM, and Java's inherent limitations (e.g., "maximum array size exceeded" errors) become problematic with large datasets. The proposed solution is to refactor the analysis portion into native code, streaming the results back to the Ghidra plugin via an Inter-Process Communication (IPC) mechanism. This would not only dramatically improve performance and memory efficiency but also enable real-time trace analysis.
Other planned enhancements include:
- Relative Value Readjustment: Currently, statistical values like entropy and frequency are calculated globally across the entire trace. When a user filters the data to a specific region or set of basic blocks, these values remain relative to the global set. Future work aims to dynamically readjust these metrics to be relative only to the currently filtered local set, providing more meaningful insights within a narrowed scope.
- Shared Frequencies Analysis: Many basic blocks might execute with the same frequency. Catalyst plans to introduce a feature to recognize and group these blocks by their shared frequencies, allowing users to quickly filter and analyze all code paths that exhibit a specific execution count.
The speakers also noted their experimentation with other instrumentation frameworks. While Frida was explored, it ultimately did not provide the required level of granularity for their control flow traces. Intel Pin, another dynamic binary instrumentation tool, yielded results similar to DynamoRIO, suggesting that the choice of tracing engine can be flexible, provided it produces the necessary granular data.
Demo / Proof of Concept
▶ Watch: Live Demo: Filtering Catalyst heat map to find firmware upload (11:00)
The practical utility of Catalyst was vividly demonstrated through an analysis of Mongoose, an embedded web server. This target was chosen as a representative example of software commonly found in devices like routers, where web panels serve as configuration interfaces. The objective of the demo was to efficiently locate the specific code handler responsible for the "upload firmware" functionality within the Mongoose binary.
The demonstration proceeded as follows:
- Trace Acquisition: The Mongoose web server was wrapped in a DynamoRIO trace client using a simple
test.shscript. This setup allowed DynamoRIO to monitor and record the execution of the web server. - Interactive Tracing: John Cipriati logged into the Mongoose web dashboard. The critical step involved interacting with the "upload firmware" button. To ensure the code path was thoroughly exercised, a JavaScript script (generated by ChatGPT) was used to repeatedly spam the associated route. The errors generated by the spamming were deemed irrelevant, as the primary goal was simply to ensure the target code path was executed.
- Ghidra Integration: The Mongoose binary was then imported and analyzed in Ghidra. Subsequently, the DynamoRIO-generated trace file was loaded into the Catalyst plugin. Loading the trace, especially a large one, can take some time, which was expedited in the presentation.
- Heatmap Analysis: Once loaded, Catalyst populated its heatmap and table view. The heatmap immediately revealed distinct patterns of activity:
- Initial "blips" of activity: These represented the program's startup phase, including socket creation and memory allocation for connection tracking.
- A pause, followed by another blip: Likely the serving of the login page.
- Another pause, then three more blips: Corresponding to the user logging in and subsequent web pages being served.
- A significant, long pause, culminating in the "hottest spot" on the graph: This highly active region directly correlated with the execution triggered by the JavaScript spamming of the
upload firmwareroute.
- Targeted Filtering: Focusing on this "hottest spot" region, Cipriati then applied several filters in the table view to narrow down the relevant code:
- External Filter: Set to
falseto exclude code from shared libraries that might not be part of the primary program database, focusing only on internal Mongoose code. - Region Exclusivity: Filtered to show only basic blocks that executed exclusively within the selected "hottest spot" time region.
- Frequency Filter: Crucially, the execution frequency was filtered to
313, the exact number of times the route was spammed by the ChatGPT-generated script. This highly specific filter dramatically reduced the dataset.
- Identification of Handler: The filtering process reduced hundreds of potential functions to a manageable set, in this case, only about seven. Upon inspecting the first function in the filtered list, confirmation was found on line 26 of the decompiled code, explicitly identifying it as the "handler for uploading firmware to the device."
This demo powerfully illustrated how Catalyst can rapidly guide a reverse engineer to a specific piece of functionality, even in a large and unfamiliar binary, by leveraging dynamic execution data and statistical filtering.
Defensive Implications
▶ Watch: Q&A: Differential analysis and handling multiple trace runs (15:00)
The capabilities demonstrated by Catalyst have significant implications for defensive security postures, offering enhanced tools for vulnerability research, incident response, and malware analysis:
- Accelerated Vulnerability Discovery: By quickly identifying areas of high complexity (via entropy analysis) or anomalous execution patterns (e.g., unbalanced ref counts leading to use-after-free), Catalyst can help security researchers pinpoint potential vulnerabilities much faster in large and complex binaries. This is especially critical for embedded systems firmware or proprietary software where source code is unavailable.
- Enhanced Malware Analysis: When analyzing sophisticated malware, understanding its precise execution flow and interaction with the system is paramount. Catalyst's granular, timestamped control flow traces can help analysts quickly identify specific malicious routines, understand their temporal dependencies, and trace their interactions with system calls or other components, even when obfuscation techniques are employed.
- Improved Incident Response: During an incident, understanding how an attacker's payload executed and what code paths were triggered is crucial for containment and eradication. By tracing the execution of a suspected malicious process, Catalyst can help incident responders quickly isolate the exact functions and basic blocks involved in a compromise, providing concrete evidence and guiding remediation efforts.
- Firmware Analysis for Embedded Devices: As demonstrated with Mongoose, Catalyst is particularly well-suited for analyzing firmware for IoT devices, routers, and other embedded systems. These devices often lack debugging symbols and run highly optimized code. The ability to dynamically trace specific functionalities (like firmware updates or web panel interactions) drastically simplifies the process of identifying vulnerabilities or backdoors.
- Understanding Unintended Behavior: Beyond malicious activity, the tool can aid in understanding any unexpected program behavior. If a system exhibits an anomaly, tracing its execution under specific conditions can reveal the exact code paths leading to that behavior, facilitating debugging and root cause analysis.
- Auditing and Assurance: For organizations developing or deploying critical software, Catalyst offers a way to audit the actual runtime behavior of compiled binaries against design specifications. It can help ensure that only intended code paths are executed for specific operations, reducing the attack surface.
Key Takeaways
- Reverse engineering is a fundamentally tedious and manual process, exacerbated by modern compiler optimizations and large binary sizes. Tools that augment static analysis are crucial for efficiency.
- Traditional static analysis is limited in understanding runtime behavior; dynamic analysis, particularly code coverage, is essential for insights into actual execution.
- Standard code coverage often includes irrelevant execution paths, making interpretation difficult. Control flow traces with timestamps provide superior granularity, capturing every change in execution flow.
- The Catalyst Ghidra plugin leverages these granular traces, using heatmaps and statistical filtering (e.g., by execution frequency and branch target entropy) to rapidly identify and scope relevant code paths.
- Catalyst is highly effective for tasks such as detecting unbalanced ref counts (potential use-after-free), identifying complex and potentially buggy code through entropy analysis, and resolving indirect jumps/calls in compiled binaries.
- Future development will focus on performance improvements by moving core analysis to native code with IPC, and enhancing user experience with dynamic adjustment of statistical values and grouping by shared frequencies.
- The tool significantly benefits defensive security by accelerating vulnerability discovery, enhancing malware and incident response analysis, and streamlining firmware auditing for embedded systems.
About the Speaker(s)
John Cipriati is a Cyber Engineer at Zetier. His professional work involves vulnerability research, reverse engineering, and development to support these goals. He specializes in Quick Reaction Capability (QRC), which involves delivering results on compressed schedules. John has a background in video game hacking, a passion he has pursued since childhood, which ultimately led him into the cybersecurity field. He also likes cats.
Joe Dussault is also a Cyber Engineer at Zetier, where he focuses on reverse engineering, vulnerability research, and C++ development. Joe shares a background in video game hacking with John, which is how they met. While he enjoys playing video games, he also has a professional inclination to "break things," often intentionally in the pursuit of finding vulnerabilities, though sometimes unintentionally, as his colleagues might attest.
Reviews
Dr. Zero (Offensive Security Researcher) — SOLID
Competent tool talk that solves a real workflow problem — filtering noisy dynamic traces to find relevant code paths faster. The entropy-as-complexity angle is interesting but underdeveloped. This is solid engineering work packaged as a conference talk, not research that moves the field.
Heather Calloway (CISO) — SOLID
Solid tooling work that makes RE faster for teams doing firmware audits or malware triage. Not a strategic priority for most security programs, but if you have a team doing binary analysis on embedded devices or incident artifacts, this is worth their time.