The State of Prometheus and OpenTelemetry Interoperability - Arthur Sens & Juraj Michálek
Arthur Sens, Juraj Michálek
KubeCon + CloudNativeCon Europe 2025 · Session
Overview
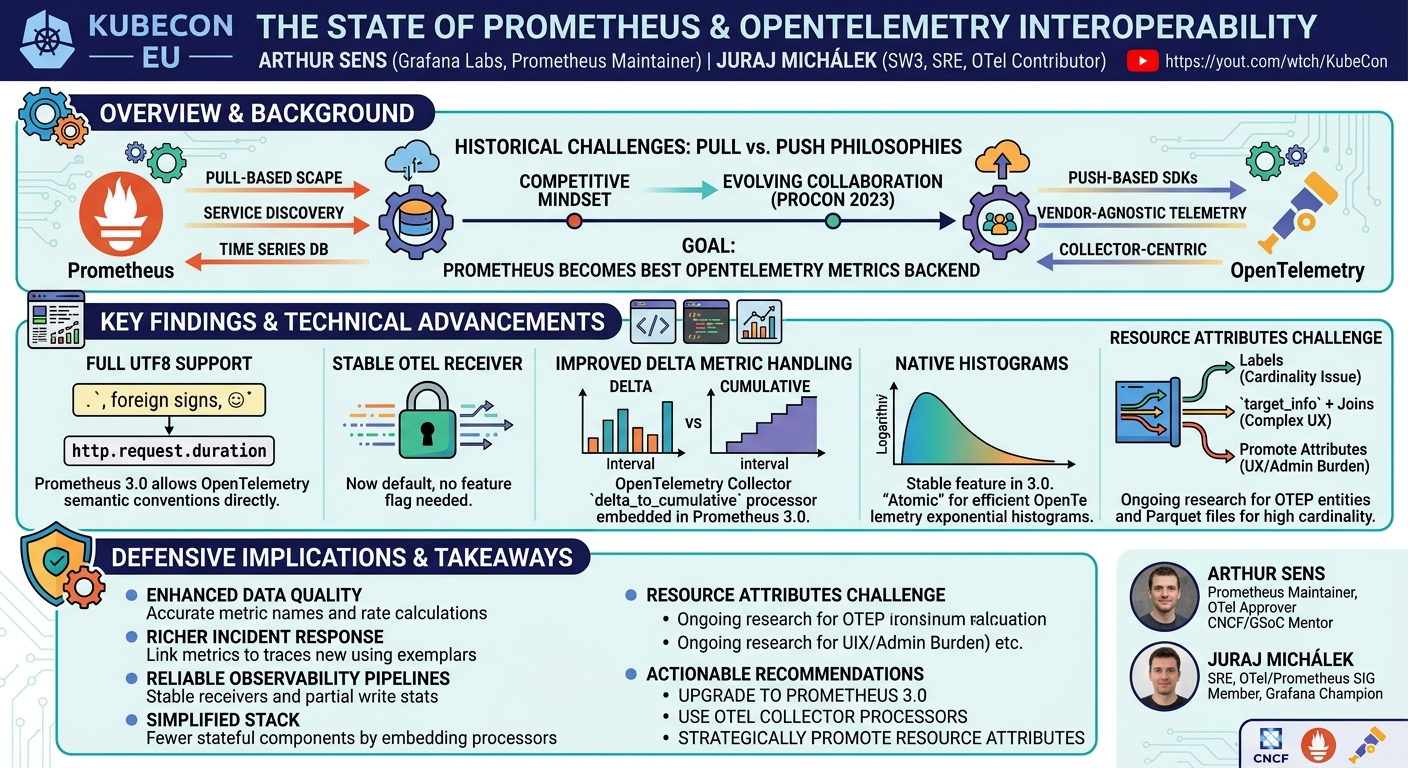
The talk "The State of Prometheus and OpenTelemetry Interoperability" by Arthur Sens and Juraj Michálek at KubeCon EU dives deep into the complex, yet increasingly crucial, relationship between two of the most dominant observability projects in the cloud-native ecosystem: Prometheus and OpenTelemetry. For years, these technologies, while both focused on telemetry, developed with distinct philosophies and technical approaches, leading to friction and an often-frustrating experience for users attempting to integrate them. This presentation illuminates the historical challenges, the significant strides made towards seamless interoperability, and the ongoing work to bridge remaining gaps.
Key moments
- 0:52 Prometheus and OpenTelemetry philosophical differences
- 3:20 Initial competition and the 'Tree of Monkeys' analogy
- 4:15 Prometheus as a backend, OpenTelemetry as telemetry creator
- 4:40 Prometheus commits to being the best OpenTelemetry backend
- 5:20 Prometheus 3.0 release driven by OpenTelemetry interoperability
- 6:00 Prometheus 3.0 introduces full UTF8 support for OpenTelemetry
- 7:10 Future work: Prometheus adopting OpenTelemetry schemas
The State of Prometheus and OpenTelemetry Interoperability
Speakers: Arthur Sens, Maintainer at Grafana Labs; Juraj Michálek, SRE at SW3
Conference: KubeCon EU
YouTube: https://www.youtube.com/watch?v=JFS0lSfHtMI
Overview
The talk "The State of Prometheus and OpenTelemetry Interoperability" by Arthur Sens and Juraj Michálek at KubeCon EU dives deep into the complex, yet increasingly crucial, relationship between two of the most dominant observability projects in the cloud-native ecosystem: Prometheus and OpenTelemetry. For years, these technologies, while both focused on telemetry, developed with distinct philosophies and technical approaches, leading to friction and an often-frustrating experience for users attempting to integrate them. This presentation illuminates the historical challenges, the significant strides made towards seamless interoperability, and the ongoing work to bridge remaining gaps.
Arthur Sens, a long-time Prometheus maintainer and recent OpenTelemetry contributor, alongside Juraj Michálek, an SRE with a focus on observability and a contributor to both projects, bring a unique perspective from both sides of the fence. They candidly acknowledge the initial competitive mindset within the Prometheus community regarding OpenTelemetry, likening it to a "tree of monkeys" scenario where collaboration was overshadowed by perceived rivalry. However, the core message is one of evolving collaboration, with Prometheus now aiming to be the "best OpenTelemetry metrics backend." This shift is not merely philosophical but is driving substantial technical changes, particularly with the release of Prometheus 3.0 and continuous enhancements to the OpenTelemetry Collector.
The talk is highly relevant for anyone operating or developing within cloud-native environments, especially those grappling with observability strategies involving both Prometheus for metrics collection and OpenTelemetry for unified telemetry generation. It provides critical insights into how these projects are converging, offering solutions to long-standing problems like character encoding, metric type conversions, and the challenging handling of resource attributes. Understanding these developments is essential for optimizing observability pipelines, reducing operational overhead, and ensuring accurate, comprehensive monitoring in complex distributed systems.
Background
▶ Watch: Prometheus and OpenTelemetry philosophical differences (0:52)
The journey towards Prometheus and OpenTelemetry interoperability began with fundamental philosophical differences in how they approach metric collection. Prometheus, established as a de-facto standard for monitoring cloud-native applications, is built predominantly on a pull-based model. In this paradigm, Prometheus servers actively scrape metrics from instrumented targets at regular intervals, relying on service discovery to identify what needs to be monitored. This approach offers advantages such as monitoring for failed scrapes (e.g., using the up metric) and robust anomaly detection based on consistent scrape intervals. However, it requires applications to keep metrics in memory, potentially wasting CPU and network resources if metric values don't change frequently.
Conversely, OpenTelemetry, particularly in its current implementation, primarily employs a push-based model. Applications instrumented with OpenTelemetry SDKs generate telemetry data (metrics, traces, logs) and push it to a collector or backend. While this avoids the need for applications to maintain metrics in memory and allows pushing data only when actual changes occur, it historically lacked the inherent service discovery capabilities of Prometheus. This made it difficult for a backend to discern between an application that genuinely shut down versus one that was temporarily unreachable due to network issues. Furthermore, Prometheus's design for regular, interval-based pulls is deeply embedded in its PromQL functions, which depend on these characteristics for accurate rate and increase calculations, even handling counter resets gracefully.
These architectural divergences initially fostered a sense of competition. Prometheus is fundamentally a time series database focused on metrics, offering robust monitoring and alerting features. OpenTelemetry, on the other hand, is not a backend or a database; its core mission is to provide a vendor-agnostic standard for creating and exporting telemetry, ensuring consistent context propagation across different telemetry types (metrics, traces, logs) and compatibility with various backends. While both offer SDKs for application instrumentation, Prometheus's SDKs are optimized for its specific model, whereas OpenTelemetry's SDKs are designed for broad compatibility and context propagation across different vendors. This distinction, initially perceived as a rivalry over SDKs, gradually led to the realization that OpenTelemetry needs a good backend for its metrics, and Prometheus is uniquely positioned to fulfill that role.
The turning point was explicitly stated at PromCon 2023, where the Prometheus team collectively decided to embrace OpenTelemetry and strive to become its "best metrics backend." This strategic alignment necessitated significant changes within Prometheus, culminating in the release of Prometheus 3.0. Many of the breaking changes introduced in this major version were directly motivated by the need to enhance OpenTelemetry interoperability, marking a definitive shift from competition to collaboration.
Key Findings
▶ Watch: Prometheus as a backend, OpenTelemetry as telemetry creator (4:15)
The talk highlights several critical developments and ongoing efforts that underpin the enhanced interoperability between Prometheus and OpenTelemetry, many of which are introduced or significantly advanced in Prometheus 3.0:
- Full UTF8 Support: Prometheus 3.0 now natively accepts the entire UTF8 character set, including foreign characters, dots, symbols, and emojis. This is a monumental change from its historical limitation to English characters, digits, underscores, and colons, making it compatible with OpenTelemetry's semantic conventions which heavily utilize dots (e.g.,
http.request.duration). - Stable OpenTelemetry Receiver Endpoint: The OpenTelemetry receiver endpoint in Prometheus is now stable and no longer requires a feature flag, though a security flag is still necessary to prevent accidental exposure of a write endpoint.
- OpenTelemetry Schema Adoption (Work in Progress): Prometheus is actively working on adopting OpenTelemetry schemas, allowing it to query metrics following different naming conventions (e.g., legacy Prometheus vs. OpenTelemetry semantic conventions) as a single logical metric in graphs.
- Improved Delta Metric Handling: While Prometheus traditionally handles only cumulative counters, the OpenTelemetry Collector now includes a
delta to cumulative processorto convert OpenTelemetry delta metrics before ingestion. Furthermore, there are ongoing discussions and proposals to enable native delta ingestion and dedicated PromQL functions for delta metrics in Prometheus. - Native Histograms as a Stable Feature: Prometheus 3.0 introduces native histograms as a stable feature, offering improved performance and accuracy over classic histograms. Their atomic nature significantly benefits OpenTelemetry by allowing exponential histograms to be shipped in a single remote write request.
- Prometheus Remote Write Protocol V2 (RW V2): This new protocol version in Prometheus 3.0 is a cornerstone of improved interoperability. It adds native support for native histograms, exemplars (for linking metrics to traces), series-scoped metadata, created timestamps (for rate accuracy), and full UTF8 support, all designed to enhance compatibility with OpenTelemetry.
- Enhanced OpenTelemetry Collector Components: The OpenTelemetry Collector now features a stateless Prometheus remote receiver leveraging RW V2, improving its efficiency and handling of exponential histograms. Ongoing work is also focused on implementing RW V2 support in the remote write exporter.
- Resource Attributes Challenge and Evolution: The handling of resource attributes from OpenTelemetry within Prometheus remains a significant challenge. The talk outlines the progression of strategies—from direct label conversion (leading to cardinality issues) to the
target_infometric with PromQL joins (complex for users), and finally to a user-configurablepromote_resource_attributesoption (better UX, but problematic for admins). Ongoing UX research and proposals like the OTEP for entities aim to provide a more robust and scalable solution.
Technical Deep Dive
▶ Watch: Prometheus commits to being the best OpenTelemetry backend (4:40)
The technical advancements driving Prometheus and OpenTelemetry interoperability span several critical areas, reflecting a deep commitment to resolving long-standing compatibility issues.
UTF8 Support
Historically, Prometheus metric names and label values were restricted to a narrow character set: digits, English alphabet characters, underscores, and colons. This limitation became a significant hurdle for OpenTelemetry adoption, as OpenTelemetry's semantic conventions frequently use dots (e.g., http.request.duration) and its design embraces the full UTF8 character set, allowing for foreign characters, symbols, and even emojis. In Prometheus 3.0, this restriction has been lifted, with Prometheus now accepting UTF8 by default. This change is crucial because without it, the direct adoption of OpenTelemetry metrics, especially those following semantic conventions, would be impossible without lossy translations.
While Prometheus itself now accepts UTF8, there's still work to be done. The OpenTelemetry Collector's Prometheus exporters (both Prometheus exporter and Prometheus remote write exporter) currently translate UTF8 characters to underscores when sending data to older Prometheus versions or when the OpenTelemetry spec requires it for compatibility. Arthur Sens expressed a clear intent to propose changes to the OpenTelemetry spec to allow UTF8 characters to be sent directly to Prometheus without translation, ensuring a cleaner, more accurate data flow. Furthermore, while Prometheus 3.0 accepts UTF8, some Prometheus-compatible backends may not, requiring users to verify their entire observability stack's compatibility.
Delta Metrics
The distinction between cumulative and delta counters is a core difference in how Prometheus and OpenTelemetry handle increasing values. Prometheus primarily uses cumulative counters, where a metric always increases, and any decrease signifies a reset, which PromQL's rate() and increase() functions are designed to handle. OpenTelemetry, however, supports both cumulative and delta counters. A cumulative counter in OpenTelemetry behaves similarly to Prometheus, accumulating values over time. A delta counter, on the other hand, measures the change in value between consecutive measurements. For example, if an application receives 12 requests in one 10-second interval, the cumulative counter goes to 12, and the delta is 12. If in the next 10 seconds, it receives 2 requests, the cumulative goes to 14, but the delta is only 2.
To bridge this gap, the OpenTelemetry Collector includes a delta to cumulative processor. This processor is stateful, meaning it holds the previous measurement in memory to calculate the cumulative value from incoming delta metrics before forwarding them to Prometheus. Recognizing the operational complexity of managing a separate stateful process, the authors have embedded this processor directly into Prometheus, allowing Prometheus to perform the conversion internally. This reduces the number of stateful components users need to manage. However, this is seen as an interim solution. The long-term vision involves Prometheus natively ingesting delta metrics and potentially introducing new PromQL functions specifically designed to query and analyze delta values directly, avoiding the need for conversion at ingestion time. This is an active area of discussion and development.
Native Histograms
Native histograms are a significant improvement introduced in Prometheus 3.0, enhancing both the performance and accuracy of histogram metrics. Unlike classic histograms, which rely on predefined buckets, native histograms use a sparse, logarithmic data structure that adaptively captures value distributions. This makes them more efficient in terms of storage and computation, especially for high-cardinality data or when precise quantile estimations are required.
Crucially for OpenTelemetry interoperability, native histograms are "atomic," meaning a complete histogram can be contained within a single request. This contrasts with older histogram implementations where individual buckets might be treated as separate time series. This atomicity was a key enabler for the Prometheus remote receiver in the OpenTelemetry Collector, allowing it to process OpenTelemetry's exponential histograms more efficiently. While native histograms are stable in Prometheus 3.0, some work remains, particularly regarding their representation in the OpenMetrics text format and further refinements on the query side.
Prometheus Remote Write Protocol V2
The Prometheus Remote Write Protocol V2 (RW V2), part of Prometheus 3.0, is a comprehensive overhaul designed to address many limitations of its predecessor and significantly boost OpenTelemetry compatibility. Key features include:
- Native/Classic Histogram Support: RW V2 provides native support for both native histograms and classic histograms, streamlining their transmission.
- Exemplars: This feature, previously experimental, is now natively supported. Exemplars allow linking specific metric data points to traces, providing crucial context for debugging and troubleshooting distributed systems.
- Native Metadata Support: Metadata (description, type, unit) is no longer optional and is now scoped to the actual series rather than just the metric name. This solves a common problem where different applications might use the same metric name but with conflicting metadata (e.g., different units), leading to conflicts. With series-scoped metadata, each unique series can have its own metadata, resolving these ambiguities.
- Created Timestamp Support: Including a
created timestampin the protocol improves the accuracy ofrate()calculations, especially for short-lived time series. - Full UTF8 Support: Directly supports UTF8 characters, eliminating the need for translations that were previously required in RW V1 to ensure compatibility with Prometheus's limited character set.
The impact of RW V2 on the OpenTelemetry Collector is profound. It enabled the development of a stateless Prometheus remote receiver in the collector, making it more robust and easier to manage. It significantly improves the handling of OpenTelemetry's exponential histograms by allowing them to be shipped as a single, atomic native histogram within a single request, avoiding the fragmentation and metadata conflicts that arose from splitting them into multiple time series. Furthermore, RW V2 introduces partial write statistics, giving the OpenTelemetry Collector feedback on whether a request was partially written, how much data was rejected, and if a retry is warranted, enhancing the reliability of data transmission. Ongoing work is focused on implementing full RW V2 support in the OpenTelemetry Collector's remote write exporter.
Resource Attributes
The handling of resource attributes is arguably the most challenging aspect of Prometheus and OpenTelemetry interoperability. OpenTelemetry SDKs excel at automatically discovering and propagating rich contextual information about the source of telemetry, such as Java version, OS name, container ID, Kubernetes pod details, etc. These resource attributes provide invaluable context for understanding application behavior. However, mapping this high-cardinality, often dynamic metadata to Prometheus's label-based model has proven difficult.
The talk outlines three evolutionary strategies and ongoing research:
- All Resource Attributes as Labels: The initial, straightforward approach was to convert every resource attribute into a Prometheus label. This quickly led to severe cardinality issues, as labels like
pod_id,container_id, orjava_cmd_linegenerate a massive number of unique time series, overwhelming Prometheus's memory and CPU resources. Queries like "sum memory usage by Java command line" are rarely useful and demonstrate the misuse of labels for high-cardinality, non-queryable metadata. - Target Info Metric with PromQL Joins: The current OpenTelemetry spec suggests translating all resource attributes into a single metric called
target_info. Users then employ PromQL joins to link thesetarget_infolabels back to the relevant metrics. While this mitigates direct cardinality issues on core metrics, it introduces a significant user experience barrier. PromQL joins are notoriously complex, even for experienced Prometheus maintainers, making this approach impractical for many users. - Promote Resource Attributes: The current "best user experience" strategy involves a configuration option,
promote_resource_attributes, where users explicitly define which resource attributes should be promoted to Prometheus labels. This gives users control over cardinality. However, it shifts the burden to the Prometheus admin, who must manage this configuration. Any change to promoted attributes, or even the underlying resource attributes themselves, effectively creates new time series IDs in Prometheus. This leads to memory spikes (as both old and new series are temporarily held) and necessitates Prometheus restarts, potentially breaking installations.
To address these persistent challenges, ongoing UX research is underway, including interviewing users and co-founders to understand expectations for handling resource attributes in metric databases. A promising direction is an OTEP (OpenTelemetry Enhancement Proposal) focused on entities. This proposal aims to restore the scope of resource attributes, allowing Prometheus to understand which attributes belong to a Kubernetes entity, a container, or a host, rather than treating them as a flat bag of information. This structured approach could enable smarter processing and storage. Another very early-stage working group is exploring the use of Parquet files for handling high-cardinality attributes, which could be particularly beneficial for OpenTelemetry's resource attributes given their often hundreds of unique values.
Demo / Proof of Concept
▶ Watch: Prometheus 3.0 introduces full UTF8 support for OpenTelemetry (6:00)
While the talk did not feature a live, interactive demonstration, the speakers presented several screenshots and visual aids throughout their presentation to illustrate key concepts and the impact of the discussed features. For instance, a screenshot was used to show the status of issues resolved for native histograms, indicating that 733 issues had been resolved with only one pending, signifying its near-official stability. Similarly, the presentation included illustrations distinguishing between cumulative and delta counters, and diagrams depicting the architectural flow of metrics through the OpenTelemetry Collector and into Prometheus. These visual elements served as effective proof points for the technical advancements and ongoing work, even in the absence of a live code demonstration.
Defensive Implications
▶ Watch: Future work: Prometheus adopting OpenTelemetry schemas (7:10)
For security and operations teams, the advancements in Prometheus and OpenTelemetry interoperability offer significant defensive implications, primarily by improving the quality, context, and reliability of observability data.
- Enhanced Data Quality and Accuracy: The full UTF8 support in Prometheus 3.0 means that OpenTelemetry semantic conventions can be ingested directly without lossy character translations. This ensures that metric names and labels retain their intended meaning and structure, leading to more accurate queries and alerts. Similarly, Prometheus Remote Write Protocol V2 with its
created timestampsupport improves the accuracy of rate calculations, crucial for detecting subtle performance degradation or anomalous activity. - Richer Context for Incident Response: The native support for exemplars in RW V2 is a game-changer. By linking metrics to traces, defenders can quickly pivot from a metric anomaly (e.g., high error rate) to the specific distributed trace that caused it. This drastically reduces the Mean Time To Resolution (MTTR) for complex incidents in microservices architectures, allowing for faster identification of root causes.
- Improved Observability Pipeline Reliability: The OpenTelemetry Collector's enhanced Prometheus remote receiver (stateless, with RW V2 support) and the introduction of
partial write statisticsin RW V2 contribute to a more robust and reliable data ingestion pipeline. Defenders can have greater confidence that telemetry data is being collected and stored correctly, even under stress, and can quickly identify and troubleshoot issues with data transmission. - Better Management of High-Cardinality Data (Future): While resource attributes remain a challenge, the ongoing work, particularly around the OTEP for entities and the exploration of Parquet files, promises a future where valuable contextual information can be stored and queried efficiently without overwhelming Prometheus with cardinality issues. This will allow defenders to filter and analyze metrics based on rich application, host, or container metadata, which is critical for security investigations and identifying compromised components.
- Simplified Observability Stack: The embedding of the
delta to cumulative processordirectly into Prometheus reduces the number of stateful components in the observability stack. This simplifies deployment, maintenance, and troubleshooting, lowering the operational burden on SREs and security engineers. - Actionable Recommendations:
- Upgrade to Prometheus 3.0: To leverage the full suite of improvements, including UTF8 support, native histograms, and RW V2, upgrading Prometheus to version 3.0 is paramount.
- Utilize OpenTelemetry Collector Processors: For existing setups or specific needs, leverage the OpenTelemetry Collector's powerful processors (e.g.,
delta to cumulative,transformfor relabeling) to preprocess metrics before sending them to Prometheus. - Strategically Promote Resource Attributes: Until a more robust solution for resource attributes is mature, carefully consider and configure the
promote_resource_attributesoption in Prometheus to balance contextual richness with cardinality management. Prioritize attributes essential for querying and alerting. - Engage with the Community: Stay informed about the ongoing developments, particularly regarding delta ingestion, resource attributes, and OTEPs for entities. Participating in community discussions and providing feedback can influence the direction of these critical features.
Key Takeaways
- Prometheus 3.0 marks a pivotal shift towards deep interoperability with OpenTelemetry, driven by a collaborative mindset rather than competition.
- Key technical advancements include native UTF8 support, stable OpenTelemetry receiver, and the new Prometheus Remote Write Protocol V2, which together streamline data ingestion and enhance data quality.
- Prometheus Remote Write Protocol V2 is crucial, adding native support for native histograms, exemplars (linking metrics to traces), series-scoped metadata, and created timestamps, significantly improving context and accuracy.
- Handling OpenTelemetry's resource attributes within Prometheus remains a complex challenge, with ongoing research and proposals like the OTEP for entities aiming for more scalable and user-friendly solutions beyond current label promotion or
target_infometric approaches. - Defenders should prioritize upgrading to Prometheus 3.0, leveraging the OpenTelemetry Collector's processing capabilities, and carefully managing resource attributes to gain richer context, improve data accuracy, and enhance incident response capabilities.
- Future work includes native delta ingestion, further refinements to OpenTelemetry spec for UTF8 and native histograms, and exploring advanced storage solutions like Parquet files for high-cardinality attributes.
About the Speaker(s)
Arthur Sens is a prominent figure in the observability space, currently working for Grafana Labs. He has been a dedicated maintainer of Prometheus for several years and has recently expanded his contributions to OpenTelemetry, achieving approver status in the OpenTelemetry Collector project within a relatively short period. Arthur is also actively involved in mentorship programs through CNCF, Google Summer of Code, and LFX, demonstrating his commitment to fostering new talent in the cloud-native community. His role at Grafana Labs specifically involves ensuring strong interoperability between Prometheus and OpenTelemetry.
Juraj Michálek is an SRE (Site Reliability Engineer) with a specialized focus on observability at SW3. He is an active contributor to the OpenTelemetry and Loki/Grafana (LGTM) stack. Juraj is also a key member of the OpenTelemetry and Prometheus Special Interest Group (SIG), which is dedicated to improving the collaboration and technical integration between these two critical projects. His expertise and contributions were recognized last year when he became a Grafana Champion.
Reviews
Dr. Zero (Offensive Security Researcher) — MUST SEE
This talk by Arthur Sens and Juraj Michálek is a critical deep dive into the evolving interoperability between Prometheus and OpenTelemetry. It meticulously details the architectural shifts, particularly with Prometheus 3.0 and the new Remote Write Protocol V2, that enable full UTF8 support, native histograms, and crucial exemplar linking. While acknowledging the persistent challenges with resource attributes, the speakers, both core maintainers, provide invaluable insider signal on the future direction, making this essential viewing for anyone serious about cloud-native observability. This isn't just a status update; it's a roadmap from the architects themselves.
Heather Calloway (CISO) — STRONG ACCEPT
This session provides a crucial update on the convergence of Prometheus and OpenTelemetry, detailing the strategic shift from competition to collaboration. It clearly outlines the technical advancements in Prometheus 3.0 and RW V2 that directly enhance observability data quality, context, and reliability. While deeply technical, the implications for incident response, operational resilience, and the strategic management of telemetry data are significant for any organization operating cloud-native infrastructure. The candid discussion of challenges, particularly with resource attributes, demonstrates a realistic and actionable approach.