Prometheus Deep Dive: What’s New in v3.0 and Beyond - Saswata Mukherjee & Fiona Liao
Saswata Mukherjee, Fiona Liao
KubeCon + CloudNativeCon Europe 2025 · Session
Overview
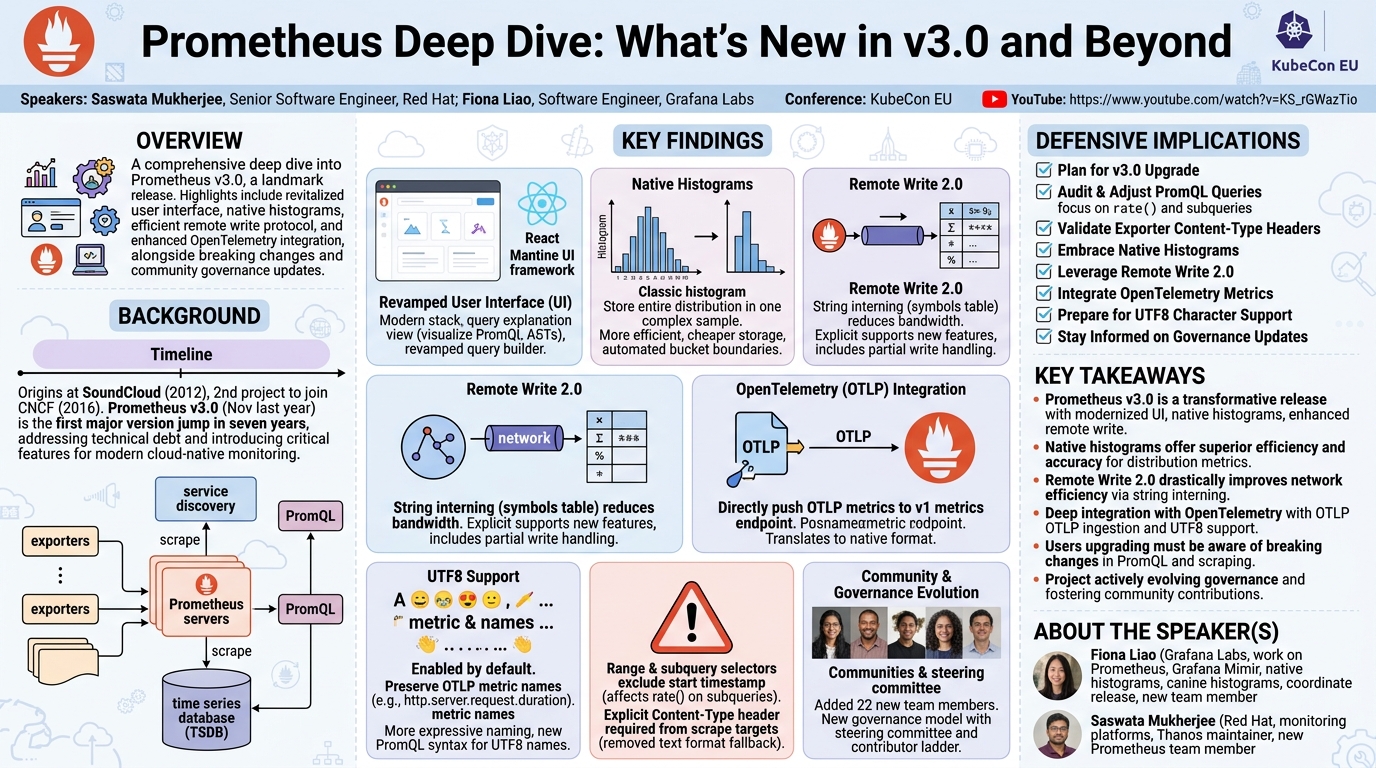
This talk provides a comprehensive deep dive into Prometheus v3.0, a landmark release marking seven years since the previous major version. Presented by Fiona Liao from Grafana Labs and Saswata Mukherjee from Red Hat, both newly inducted Prometheus team members, the session illuminates the significant advancements and future directions of the cloud-native monitoring stalwart. The speakers detail a revitalized user interface, the introduction of native histograms, a more efficient remote write protocol, and enhanced OpenTelemetry integration, alongside crucial breaking changes and community governance updates.
Key moments
- 0:00 Talk introduction and Prometheus overview
- 3:30 Prometheus 3.0 release and major developments
- 4:00 Modernized Prometheus UI with React and Mantine
- 5:50 PromQL query explanation and builder view
- 7:00 Introduction to native histograms for efficient storage
Prometheus Deep Dive: What’s New in v3.0 and Beyond
Speakers: Saswata Mukherjee, Senior Software Engineer, Red Hat; Fiona Liao, Software Engineer, Grafana Labs
Conference: KubeCon EU
YouTube: https://www.youtube.com/watch?v=KS_rGWazTio
Overview
This talk provides a comprehensive deep dive into Prometheus v3.0, a landmark release marking seven years since the previous major version. Presented by Fiona Liao from Grafana Labs and Saswata Mukherjee from Red Hat, both newly inducted Prometheus team members, the session illuminates the significant advancements and future directions of the cloud-native monitoring stalwart. The speakers detail a revitalized user interface, the introduction of native histograms, a more efficient remote write protocol, and enhanced OpenTelemetry integration, alongside crucial breaking changes and community governance updates.
The release of Prometheus v3.0 is a pivotal moment for the widely adopted monitoring solution, addressing long-standing technical debt and introducing features critical for modern, large-scale deployments. It empowers users with better data fidelity, reduced operational overhead, and a smoother developer experience. For organizations leveraging Prometheus in their infrastructure, understanding these updates is essential for optimizing performance, ensuring data accuracy, and preparing for future observability paradigms.
The discussion extends beyond the immediate v3.0 features, offering a glimpse into ongoing work and future aspirations for the Prometheus project. This includes continued refinement of experimental features like custom buckets for native histograms, further enhancements to remote write, and deeper integration with the evolving OpenTelemetry ecosystem. The talk underscores Prometheus's commitment to remaining a robust, scalable, and adaptable monitoring backend for the cloud-native landscape.
Background
▶ Watch: Talk introduction and Prometheus overview (0:00)
Prometheus, originating at SoundCloud in 2012, has grown to become a cornerstone of the cloud-native monitoring ecosystem. It was the second project, after Kubernetes, to join the Cloud Native Computing Foundation (CNCF) in 2016, a testament to its widespread adoption and impact. At its core, Prometheus is a metric-based monitoring and alerting toolkit, offering a rich instrumentation ecosystem, efficient data collection and storage, and powerful querying, alerting, and visualization capabilities.
The Prometheus architecture relies on several key components: exporters that expose metrics in a standardized format, Prometheus servers that periodically scrape these metrics from endpoints, and service discovery mechanisms (e.g., querying the Kubernetes API) to automatically locate targets. Ingested data is stored in a time series database (TSDB), enabling querying via the Prometheus Query Language (PromQL) for visualization and alerting. This pull-based model and flexible data model have made it a favorite for monitoring dynamic, containerized environments.
The release of Prometheus v3.0 in November of the previous year, seven years after the v2.0 release, presented a significant opportunity. This major version bump allowed the project maintainers to introduce substantial improvements, clean up accumulated technical debt, and make breaking changes necessary for long-term evolution. The changes span across the user experience, data model, ingestion protocols, and ecosystem integration, addressing both immediate user needs and strategic future directions for the project.
Key Findings
▶ Watch: Prometheus 3.0 release and major developments (3:30)
Prometheus v3.0 represents a substantial leap forward, introducing several critical enhancements and foundational changes across its architecture and user experience.
- Revamped User Interface (UI): The entire Prometheus UI has been rewritten using React and the Mantine UI framework, replacing the older Bootstrap-based setup. This modernization delivers a cleaner, more consistent, and intuitive user experience, significantly improving navigation and on-call operations. Key additions include a powerful query explanation view that visualizes PromQL Abstract Syntax Trees (ASTs) and a revamped query builder for easier metric and label discovery.
- Native Histograms: A major advancement in data representation, native histograms store the entire distribution (bucket counts, sum, observations) within a single, complex sample type. This approach is significantly more efficient and cheaper to store than classic histograms, which rely on multiple samples per bucket. Native histograms automatically define bucket boundaries based on exponential growth, eliminating the need for manual configuration and reducing the risk of inappropriate bucket sizing. While still experimental, they are largely stable, with ongoing work on custom bucket support and heat map visualizations.
- Remote Write 2.0: This new iteration of the remote storage protocol focuses on efficiency and extensibility. Remote Write 2.0 vastly reduces network bandwidth costs by employing string interning for all label and metadata, effectively creating a symbol table that subsequent fields reference by index. It also explicitly supports new Prometheus features like native histograms and created timestamps, and introduces explicit partial write handling via HTTP headers, allowing senders to log errors and retry specific sample types.
- OpenTelemetry (OTLP) Integration: Prometheus v3.0 solidifies its role as a robust backend for OpenTelemetry. It now directly supports pushing metrics in the OTLP format to an OTLP v1 metrics endpoint, automatically translating them into Prometheus's native format. This integration is further enhanced by the stabilization of out-of-order ingestion and the default enablement of UTF8 support.
- UTF8 Support: Enabled by default in v3.0, UTF8 support allows Prometheus metric and label names to include any UTF8 character, moving beyond the previous limitations of letters, numbers, colons, and underscores. This is particularly beneficial for OpenTelemetry integration, as it preserves characters like dots commonly used in OTLP metric names, preventing forced translation to underscores. While enabling more expressive naming, it introduces new syntax requirements for UTF8 characters in PromQL.
- Breaking Changes and Tech Debt Reduction: The major version jump provided an opportunity to clean up technical debt and refine PromQL. Notable breaking changes include a modification to range and subquery selectors, which now exclude the sample at the start timestamp, potentially impacting functions like
rate()if not accounted for. Additionally, the implicit fallback to the Prometheus text format during scraping has been removed, requiring explicitContent-Typeheaders from targets to prevent errors.
- Community and Governance Evolution: The project announced the addition of 22 new team members, including both speakers, acknowledging their significant contributions. Furthermore, a new governance model is being introduced, featuring a smaller, elected steering committee for crucial decisions and a contributor ladder framework to recognize and involve community members more effectively, aiming for a less daunting path to contribution.
Technical Deep Dive
▶ Watch: Modernized Prometheus UI with React and Mantine (4:00)
Prometheus v3.0 introduces a suite of technical advancements designed to enhance performance, usability, and interoperability.
The New UI is a complete overhaul, migrating from a Bootstrap-based setup to React complemented by the Mantine UI framework. This modern stack is not merely aesthetic; it brings significant developer experience improvements and enables advanced features. A standout feature is the query explanation view, adapted from the upstream PromLens project. This view is powered by a brand-new Prometheus API endpoint that returns the Abstract Syntax Tree (AST) of a PromQL query. By visualizing this query tree and enriching it with inline documentation, users gain unprecedented insight into how their queries are parsed and executed. This is particularly useful for debugging complex joins, as it describes the match groups on both sides of binary operators, making it easier to spot and fix PromQL syntax errors. The revamped query builder UI further aids users by facilitating metric and metadata discovery, allowing direct selection of labels and construction of matchers from within the interface. Future UI work includes UTF8 query autocompletion and the ability to render heat maps and native histograms.
Native Histograms represent a fundamental shift in how Prometheus handles distributions. Historically, classic histograms required each bucket to be represented by a separate sample, alongside count and sum metrics, leading to a high cardinality of time series for detailed distributions. Native histograms, in contrast, store the entire distribution—all bucket counts, the sum, and the number of observations—within a single, complex sample type. This results in a more efficient and cheaper storage footprint. Unlike classic histograms where users manually define bucket boundaries (often a challenging task leading to inappropriate sizing), native histograms automatically handle this with preset boundaries based on exponential growth. Users can configure the accuracy, providing a balance between precision and storage cost. Querying native histograms also sees minor changes; for instance, the le label (less than or equal to) is no longer needed for grouping. While still experimental, the feature is largely stable, with ongoing work to finalize the text format, refine edge cases, and implement custom buckets. Custom buckets will allow users to define specific boundaries while retaining the efficiency of native histograms, easing migration from classic histograms. A draft native histogram specification provides extensive technical details.
The Remote Write 2.0 protocol builds upon the success of its predecessor by focusing on network bandwidth efficiency and support for new Prometheus data types. While still relying on Protobuf over HTTP, the key innovation lies in string interning. Instead of sending redundant label keys and values with every sample, Remote Write 2.0 introduces a symbols table within the request. All unique label data and metadata strings are stored once in this table, and subsequent fields refer to their indices. This vastly reduces the actual request size and, consequently, network bandwidth costs. The new specification also explicitly includes fields for native histograms and created timestamps, allowing these richer data types to be streamed efficiently. Furthermore, it introduces explicit partial write handling: receivers can now respond with HTTP headers detailing exact error statistics for different types of samples within a batch, enabling senders to log specific errors and retry only problematic portions. Versioning is handled via HTTP content negotiation, where the Content-Type header contains the fully qualified Protobuf name, allowing receivers to determine the protocol version dynamically. An experimental library integrated into the Prometheus client Golang library aims to simplify the creation of Remote Write 2.0 compatible senders and receivers, promoting wider adoption. Benchmarking by its initial authors, Bartk and Callum, has shown significant efficiency gains in both bandwidth and serialization. Future explorations include various compression schemes and potentially even new formats like Apache Arrow.
Prometheus's commitment to OpenTelemetry (OTLP) integration is evident in v3.0. Users can now directly push OTLP metrics to Prometheus's OTLP v1 metrics endpoint. Prometheus then automatically translates these OTLP metrics into its native format. This is complemented by the stabilization of out-of-order ingestion, which is particularly common for data received via OTLP.
The default enablement of UTF8 support in v3.0 is a significant quality-of-life improvement. Previously, Prometheus metric and label names were restricted to a limited character set. Now, any UTF8 character is supported, which is crucial for seamless OTLP integration. For instance, OTLP metric names often use dots (e.g., http.server.request.duration), which can now be preserved instead of being replaced with underscores. This, of course, also allows for more expressive naming, including emojis. New syntax is required for UTF8 metric and label names: metric names must be enclosed in curly braces, and any names or labels containing UTF8 characters must be quoted. While a major step forward, refining UTF8 support across all client libraries and addressing subtle inconsistencies with OTLP collectors (e.g., underscores in metric names vs. dots in label names) remains ongoing work. Proposals for adding type and unit as explicit metadata, rather than embedding them in metric names, are also being considered to improve user experience and enable type-aware PromQL functions. Furthermore, native delta support for OTLP metrics is being explored to avoid current conversions to cumulative metrics.
Finally, the breaking changes introduced in v3.0, while necessary for progress, require attention during migration.
- Range and subquery selectors now exclude the sample at the start timestamp. In Prometheus v2.0, a range selector
[5m]would include the sample att - 5m. In v3.0, it's(t - 5m, t], meaning the sample exactly att - 5mis excluded. This subtle change can have significant implications, especially for functions likerate()applied to subqueries where the range and resolution are the same, potentially leading to a sudden absence of data if only one point is returned instead of the expected two. - The implicit fallback to the Prometheus text format during scraping has been removed. Previously, if a target's
Content-Typeheader was missing or unrecognized, Prometheus would assume the standard text format. This could lead to silent mis-scraping of metrics in the OpenMetrics format. V3.0 now errors if the format is unclear, forcing targets to explicitly set the correctContent-Type. Afallback_scrape_protocolsetting can be configured to revert to the old behavior, but setting the correct header is the ideal fix.
Demo / Proof of Concept
▶ Watch: PromQL query explanation and builder view (5:50)
The speakers illustrated several of the new features, particularly the new UI, native histograms, and OTLP integration, through various screenshots and visual examples throughout the presentation. While a live, interactive demo of a new tool or exploit was not part of this deep dive, the visual aids effectively demonstrated the practical application and benefits of the discussed Prometheus 3.0 features. For instance, the new UI was shown displaying a query explanation view, highlighting how PromQL queries are broken down. Screenshots also showcased the querying of native histograms, illustrating bucket counts and percentile calculations, and an OpenTelemetry exponential histogram ingested via the OTLP endpoint and converted into a Prometheus native histogram, with UTF8 characters (dots) preserved in the metric name, all rendered within the new UI.
Defensive Implications
▶ Watch: Introduction to native histograms for efficient storage (7:00)
The release of Prometheus v3.0 brings significant improvements and changes that require careful consideration for organizations operating and defending their systems. Proactive adoption and adaptation will ensure continued robust monitoring and security posture.
- Plan for v3.0 Upgrade: Organizations should prioritize upgrading to Prometheus v3.0 to leverage the improved UI, enhanced efficiency, and new features. This is not just a cosmetic update but a foundational shift that will lead to better observability and reduced operational overhead in the long run.
- Audit and Adjust PromQL Queries: The change in range and subquery selector behavior (excluding the start timestamp) is a critical breaking change. Defenders must meticulously review existing PromQL queries, especially those using
rate(),increase(), ordelta()with subqueries where the range and resolution are identical. These queries may silently return no data or incorrect results post-upgrade. Thorough testing in a staging environment is essential. - Validate Exporter
Content-TypeHeaders: The removal of the implicit fallback to the Prometheus text format means that all metric exporters must explicitly set the correctContent-Typeheader (e.g.,text/plain; version=0.0.4; charset=utf-8for OpenMetrics ortext/plain; version=0.0.4for Prometheus text format). Failure to do so will result in scraping errors in Prometheus v3.0. Defenders should audit their custom exporters and ensure third-party exporters are compliant, updating configurations where necessary. - Embrace Native Histograms for Latency and Distribution Monitoring: For critical services, adopting native histograms offers a more accurate and efficient way to monitor latency and other distributions. This provides finer-grained insights into tail latencies and performance bottlenecks without the storage and cardinality overhead of classic histograms. Plan a migration strategy to leverage this feature, especially for high-volume metrics.
- Leverage Remote Write 2.0 for Scalable Storage: If utilizing remote storage solutions like Thanos, Cortex, or Grafana Mimir, advocating for and adopting Remote Write 2.0 will significantly reduce network bandwidth costs and improve the reliability of metric streaming. The string interning and explicit partial write handling mechanisms enhance efficiency and resilience, which is crucial for large-scale, distributed monitoring architectures.
- Integrate OpenTelemetry Metrics Effectively: With stable OTLP ingestion and UTF8 support, Prometheus becomes an even more compelling backend for OpenTelemetry metrics. This allows for a unified observability strategy where applications instrumented with OpenTelemetry can seamlessly push metrics to Prometheus. Defenders should explore standardizing on OTLP for application instrumentation to simplify data collection and reduce agent sprawl.
- Prepare for UTF8 Character Support: While beneficial for OTLP integration and expressive naming, the introduction of UTF8 characters in metric and label names requires vigilance. Ensure that all downstream tooling, dashboards (e.g., Grafana), and alerting systems are compatible with UTF8 characters to avoid rendering issues or missed alerts. Coordinate with development teams to adopt the new PromQL syntax for UTF8 names.
- Stay Informed on Governance and Community Updates: The evolving governance model and contributor ladder indicate a more dynamic project. Engaging with the Prometheus community channels can provide early insights into future changes, security advisories, and best practices, allowing defenders to proactively adapt their monitoring strategies.
Key Takeaways
- Prometheus v3.0 is a transformative release, introducing a modernized UI, native histograms, and enhanced remote write, marking a significant evolution after seven years.
- Native histograms offer superior efficiency and accuracy for distribution metrics, automatically managing bucket boundaries and reducing storage costs compared to classic histograms.
- Remote Write 2.0 drastically improves network efficiency through string interning and provides explicit partial write handling, making it a more robust protocol for sending metrics to remote storage.
- Deep integration with OpenTelemetry allows Prometheus to directly ingest OTLP metrics, supported by stable out-of-order ingestion and default UTF8 character support in metric and label names.
- Users upgrading to v3.0 must be aware of critical breaking changes, specifically in PromQL range selectors (excluding start timestamps) and the requirement for explicit
Content-Typeheaders during scraping. - The Prometheus project is actively evolving its governance model and fostering community contributions through new team members and a contributor ladder, indicating a vibrant future roadmap.
About the Speaker(s)
Fiona Liao is a Software Engineer at Grafana Labs, where she primarily works on Prometheus and Grafana Mimir. Her contributions to Prometheus include significant work on out-of-order native histograms and playing a key role in coordinating the v3.0 release. Fiona has recently been recognized for her contributions by becoming a Prometheus team member.
Saswata Mukherjee is a Senior Software Engineer at Red Hat, focusing on monitoring platforms largely built around Thanos and Prometheus. He is a maintainer of Thanos and, like Fiona, has recently become a Prometheus team member. Saswata also helps maintain several other CNCF-adjacent Go tools and libraries and is known online by his handle "the chasm code."
Reviews
Dr. Zero (Offensive Security Researcher) — MUST SEE
This talk delivers an exceptional deep dive into Prometheus v3.0, detailing crucial advancements in UI, data handling with native histograms, and protocol efficiency via Remote Write 2.0. Presented by core project contributors, it offers indispensable insights and actionable guidance for navigating the breaking changes and leveraging new features, making it a critical update for any Prometheus operator. It's a foundational technical deep dive that will significantly impact thousands of practitioners.
Heather Calloway (CISO) — STRONG ACCEPT
This deep dive into Prometheus v3.0, while technical, presents critical updates that directly impact an organization's monitoring resilience and security posture. The introduction of native histograms and Remote Write 2.0 offers significant operational efficiencies and data fidelity, but the breaking changes in PromQL query behavior and Content-Type header requirements pose a substantial risk of blind spots and missed alerts if not meticulously addressed. For any organization relying on Prometheus, this release necessitates a structured upgrade plan, thorough query audits, and validation of exporter configurations to maintain effective observability and prevent severe operational…