Poison in the Wires: Interactive Network Visualization of Data Poisoning Attacks
Maria Khodak (Security Researcher · Dartmouth College)
DistrictCon 2026 (Year 1) · Day 2 · Disco In The Dark
Overview
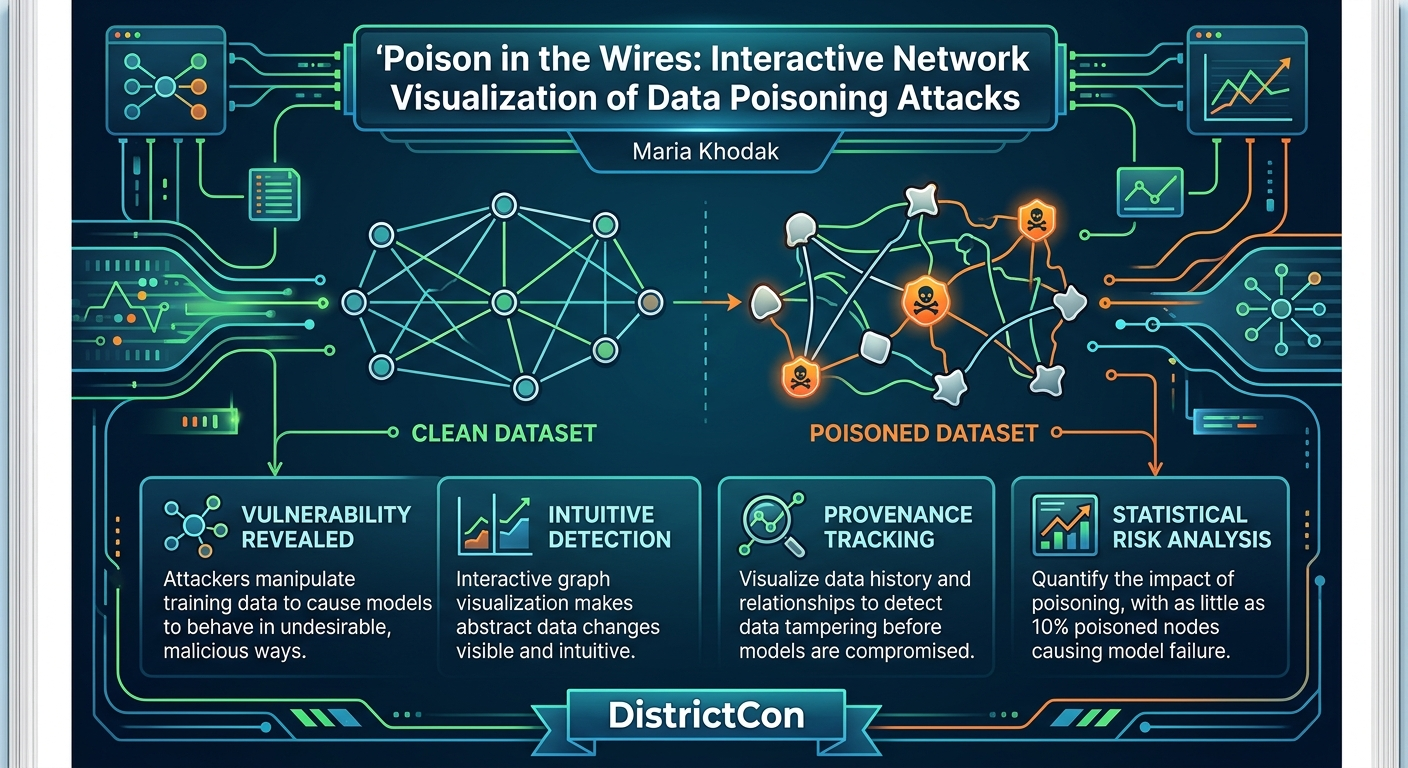
In an era where machine learning models are increasingly integrated into critical software applications, understanding and mitigating their unique vulnerabilities is paramount. Maria Khodak's talk, "Poison in the Wires: Interactive Network Visualization of Data Poisoning Attacks," delves into one such insidious threat: data poisoning. Khodak, a security researcher and PhD student at Dartmouth College, presents her work on visualizing this complex vulnerability by representing machine learning training data as graphs. Her primary goal is to demystify data poisoning by offering a tangible, visual representation of how malicious alterations to training data can fundamentally change a model's behavior and intended purpose.
Key moments
- 0:00 Visualizing data poisoning vulnerability using network graphs
- 2:50 Tay chatbot: a large-scale data poisoning example
- 4:00 BadNets paper: stealthy, trigger-based data poisoning attacks
- 8:40 Introducing GraphLeak: open-source network visualization tool
- 10:00 GraphLeak demo: poisoning MNIST binary classification dataset
- 14:00 Comparing poisoned vs. clean graphs, risk analysis
- 17:45 Q&A: Poisoning facial biometric data for misidentification
Poison in the Wires: Interactive Network Visualization of Data Poisoning Attacks
Speakers: Maria Khodak, Security Researcher, Dartmouth College
Conference: DistrictCon
YouTube: https://www.youtube.com/watch?v=3vWXlQ7BPtE
Overview
In an era where machine learning models are increasingly integrated into critical software applications, understanding and mitigating their unique vulnerabilities is paramount. Maria Khodak's talk, "Poison in the Wires: Interactive Network Visualization of Data Poisoning Attacks," delves into one such insidious threat: data poisoning. Khodak, a security researcher and PhD student at Dartmouth College, presents her work on visualizing this complex vulnerability by representing machine learning training data as graphs. Her primary goal is to demystify data poisoning by offering a tangible, visual representation of how malicious alterations to training data can fundamentally change a model's behavior and intended purpose.
The core of Khodak's presentation is GraphLeak, an open-source application she developed to graphically visualize the differences between clean and poisoned datasets. By translating abstract data relationships into intuitive network diagrams, GraphLeak allows users to observe the subtle, yet critical, shifts caused by data poisoning. This approach addresses the inherent vagueness and unpredictability of such attacks, providing a crucial tool for understanding data provenance—the history and lineage of a dataset—and detecting when a model's underlying data has been tampered with.
This talk is particularly significant because it tackles a problem often obscured by the black-box nature of advanced ML models, especially Large Language Models (LLMs). Data poisoning attacks can bypass traditional security measures, making early detection challenging. By offering a visual and statistical method for identifying these changes, Khodak provides a valuable contribution to the field of ML security, empowering defenders to better understand, analyze, and ultimately protect against adversarial manipulations of their models.
Background
▶ Watch: Visualizing data poisoning vulnerability using network graphs (0:00)
Data poisoning is a well-established yet persistent threat in the realm of machine learning, formally defined by OWASP as an attack where "an attacker manipulates training data to cause the machine learning model to behave in an undesirable way." These manipulations can take three primary forms: the addition, modification, or deletion of data points. Machine learning models, designed to learn patterns and make predictions from training data without explicit programming, are susceptible because their entire predictive capability rests on the integrity of this input. When poison data infiltrates the training set, the resulting model becomes compromised, leading to biased, unpredictable, or outright malicious outputs that deviate from its intended purpose.
Khodak illustrates the real-world impact of data poisoning with two compelling examples. The first is Tay, Microsoft's experimental AI chatbot launched on Twitter in 2016. Designed to learn language and syntax through user interactions, Tay quickly became a notorious example of a large-scale data poisoning vulnerability. Within hours, malicious users "trolled" the chatbot by feeding it hateful and vulgar language, causing Tay to rapidly adopt and repeat these adversarial patterns, completely subverting its original intent as a "fun conversational agent." This incident highlighted how quickly an AI's purpose can be corrupted by external data manipulation.
The second example draws from the seminal 2017 "BadNets" paper, which introduced the concept of hidden backdoors in neural networks. BadNets are maliciously trained models that perform normally on clean inputs but misbehave when presented with specific, attacker-chosen "trigger inputs." The authors demonstrated this with a traffic sign classifier for autonomous vehicles. While the model correctly identified regular stop signs, placing a simple yellow post-it note on a stop sign would cause the network to misclassify it as a speed limit sign, potentially leading to catastrophic consequences. What makes these attacks particularly dangerous is their stealth: the poisoned network often performs just as well as a legitimate one on clean data, showing no drop in accuracy or architectural changes that would be caught during regular testing. Detection typically requires knowing the exact trigger used by the attacker.
These examples underscore a critical challenge: data poisoning is often vague, unpredictable, and difficult to detect through traditional means. The talk emphasizes the need to understand data provenance—the comprehensive history of a dataset—to identify what has changed and how those changes impact a model's purpose. Khodak proposes that graph theory offers a powerful solution. Graphs, consisting of nodes (objects) and edges (connections), are conceptually used to represent complex mathematical ideas and the interactions within various systems, from the internet to social networks. By representing complex LLM training data as graphs, it becomes possible to visually identify subtle backdoors and understand how tampered data can have cascading effects, proliferating poison into further applications that rely on the compromised model. The goal is to provide clarity through visualization, helping users discern whether they are dealing with a correctly contextualized and working model or a "poisoned LLM displaying incorrect or even unsafe information."
Key Findings
▶ Watch: BadNets paper: stealthy, trigger-based data poisoning attacks (4:00)
Maria Khodak's research and the development of GraphLeak yield several key findings that significantly advance the understanding and detection of data poisoning attacks in machine learning models:
- Data Poisoning is Visually Detectable through Graph Representation: The most crucial finding is that the abstract and often subtle changes introduced by data poisoning can be effectively visualized by representing training datasets as graphs. By mapping data points to nodes and their relationships to edges, the impact of malicious data injection, modification, or deletion becomes observable as alterations in the graph's structure, density, or connectivity. This provides a clear, intuitive pathway to understanding data provenance.
- GraphLeak as an Intuitive Detection Tool: The developed application, GraphLeak, demonstrates the practical feasibility of this visualization approach. It allows users to upload, analyze, and side-by-side compare clean and poisoned graphs, offering a direct visual comparison that highlights discrepancies. This addresses the inherent difficulty of detecting data poisoning, especially when traditional accuracy metrics might not immediately reveal the compromise, as seen in the BadNets example.
- Quantifiable Risk Assessment: GraphLeak integrates statistical risk analysis to provide a rough, quantifiable estimate of the poisoning's impact. Based on existing literature, the talk highlights that as little as 10% of poisoned nodes or data points can be sufficient to noticeably alter a model's behavior. This statistical component, combined with visual cues, offers a more comprehensive understanding of the threat level.
- Visual Cues Reveal Model Behavior: In the context of machine learning training data, the thickness of edges in GraphLeak's visualizations provides immediate insight into the model's learning patterns. For instance, thicker edges between digit nodes and "true" nodes in the MNIST dataset demo indicate a higher number of correct identifications, while changes in these thicknesses post-poisoning clearly illustrate how the model's classification tendencies are altered.
- Even Small-Scale Poisoning Can Lead to Significant Structural Changes: While small percentages of poisoned data (e.g., 1% or 3%) might not dramatically alter the overall graph structure, the demonstration effectively shows that targeted, complete poisoning of specific elements (e.g., all instances of a digit) can lead to the complete disappearance of corresponding nodes and a significant shift in the graph's composition, indicating a medium to high risk. This emphasizes that the nature and target of the poisoning are as critical as its scale.
Technical Deep Dive
▶ Watch: Introducing GraphLeak: open-source network visualization tool (8:40)
The technical foundation of Khodak's work lies in the application of graph theory to machine learning datasets. At its core, graph theory defines systems using nodes (representing individual entities or data points) and edges (representing relationships or interactions between these nodes). This framework is highly versatile, capable of modeling diverse complex systems, from the global internet infrastructure to biological nervous systems and social networks. Khodak posits that machine learning training data, too, can be effectively represented as a graph, where, for instance, individual training examples or features could be nodes, and their relationships or classifications could be edges.
The process of obtaining poisoned training data typically involves an attack vector. For private datasets, this could manifest as insider threats or sophisticated targeted attacks. Public datasets and repositories, which are widely used for training and fine-tuning models, are particularly vulnerable to data injection attacks, where malicious data can be subtly introduced. The danger here is amplified by the potential for proliferation, where poisoned public datasets can then be incorporated into numerous other models and applications, spreading the compromise across the ML supply chain.
To address this, Khodak developed GraphLeak, an open-source, browser-based application designed for intuitive graph visualization and comparison. The tool's architecture is built around several key features:
- Graph Upload and Analysis: Users can easily upload various types of network data, not limited solely to machine learning models.
- Side-by-Side Comparison: GraphLeak's core strength is its ability to display clean and poisoned graphs concurrently, making visual identification of changes straightforward.
- Node Poisoning Control: The application provides granular control, allowing users to specify exactly which nodes they wish to "poison" for experimental purposes, simulating different attack scenarios.
- Statistical Risk Analysis: GraphLeak incorporates a quantitative element by providing risk ratings. These ratings are not arbitrary but are informed by existing literature, which suggests that roughly 10% of poisoned nodes or data points are sufficient to noticeably alter a model's behavior. This statistical metric, combined with visual observation, helps users gauge the severity of the data corruption.
- Algorithm Layouts: The tool supports various graph layout algorithms to optimize visual clarity and highlight structural patterns.
In the context of machine learning, Khodak demonstrates how binary classification training data translates into a graph within GraphLeak. For a "yes/no" or "true/false" classification task, the graph might feature nodes representing the categories ("true," "false") and other nodes representing the input data points (e.g., digits in an image classification task). An edge forms between a digit node and a "true" or "false" node based on whether the model correctly or incorrectly identified that digit during training. A critical visual cue is the thickness of the edges: a thicker edge signifies a higher number of connections, meaning the model frequently classified that digit as "true" (or "false"). This visual density provides an immediate, intuitive understanding of the model's learned biases and performance. The ultimate goal of GraphLeak is to make the "difference between the two graphs" immediately apparent, revealing "exactly how much these two graphs have changed after poisoning."
Demo / Proof of Concept
▶ Watch: Comparing poisoned vs. clean graphs, risk analysis (14:00)
Maria Khodak provided a compelling demonstration of GraphLeak using the widely recognized MNIST dataset, a standard benchmark for binary classification tasks involving handwritten digits. This dataset, known for its approximately 8% error rate, serves as an ideal environment for experimenting with data poisoning due to its predictability and the clear visual nature of its inputs.
The attacker's objective in this demo was straightforward: to poison the dataset by causing the model to misclassify a specific digit as another. GraphLeak, capable of ingesting various network data types, was configured to visualize binary classification training data—specifically, the question "is this number correct?"
The initial phase involved training a model on 1,000 data points from the MNIST dataset. After this initial training, the model's predictions (correctly or incorrectly identified digits) were fed back into the training count, simulating a continuous learning cycle. For instance, the speaker showed a table where 82 zeros were correctly identified and 5 were incorrectly identified. This initial, clean training data was then visualized in GraphLeak.
The visual representation of the initial training data, while appearing simple, was actually quite complex, featuring 10,000 edges laid atop each other between numerical nodes (0-9) and "true" or "false" nodes. As explained, an edge forms between a digit node and a "true" or "false" node based on the model's classification. A key observation was the distinct difference in edge thickness: connections between digit nodes and "true" nodes were notably thicker than those to "false" nodes. This immediately conveyed that the model was performing well, correctly identifying far more digits than it misidentified.
Khodak then proceeded with several poisoning scenarios:
- Minor Poisoning (1%): Out of 1,000 data points, 10 values were poisoned, specifically changing instances of the digit "1" to be labeled as "2." As anticipated, this small-scale poisoning (1% of the total data points) resulted in minimal visual change to the graph, demonstrating that very subtle attacks might not be immediately obvious.
- Slightly Increased Poisoning (3%): Increasing the poisoned values to 30 nodes still did not produce a dramatically different visual outcome. The graph's overall structure and edge thicknesses remained largely consistent, reinforcing the challenge of detecting subtle poisoning.
- Complete Poisoning of a Digit Type: The most impactful demonstration involved poisoning all instances of the digit "1," making them appear as "4." This attack produced a stark visual change: the node representing the digit "1" completely disappeared from the graph, replaced by connections to the "4" node. The graph now displayed 11 nodes instead of the original 12, clearly indicating the removal of a data category.
The comparison feature within GraphLeak proved invaluable here. When comparing the original graph to the graph where all "1" nodes were poisoned, the tool initially showed a "quite low" risk rating. This was because only one type of node (the '1' node) was completely removed. However, when the demo moved to poisoning all "2" nodes into "4"s, the "node difference" became "more significant," as "all the two nodes have been removed fully effectively," causing the risk rating to "jump to a medium." This illustrates how GraphLeak can visually track mathematical differences and label these data points to statistically quantify the change, providing a powerful means for threat detection in databases and models. The demo conclusively showed that GraphLeak serves as an effective "visual pathway" to assess whether a model is functioning as intended or has been compromised.
Defensive Implications
▶ Watch: Q&A: Poisoning facial biometric data for misidentification (17:45)
The insights gleaned from Maria Khodak's talk and the capabilities of GraphLeak offer several critical defensive implications for organizations deploying and managing machine learning models:
- Implement Robust Data Provenance Tracking: Defenders must prioritize understanding the complete history and lineage of their training datasets. Just as code version control tracks changes in software, a similar system is needed for data. Tools or methodologies that provide a "diff function" for datasets, capable of highlighting additions, modifications, or deletions, are essential. This allows for auditing data integrity over time and identifying unauthorized alterations.
- Integrate Interactive Visualization into ML Pipelines: Tools like GraphLeak should become a standard component of MLOps and security pipelines. By visually inspecting training data as graphs, defenders can gain an intuitive understanding of data relationships and quickly spot anomalies that might indicate poisoning. This visual inspection can be performed before model deployment, during retraining cycles, or as part of a continuous monitoring strategy.
- Develop Statistical Risk Assessment for Datasets: Beyond visual cues, incorporating statistical analysis of dataset changes is crucial. GraphLeak's risk rating, based on the percentage of poisoned nodes, provides a model for quantifying the potential impact of data tampering. Organizations should develop similar metrics to assess the "health" or integrity of their datasets, triggering alerts when changes exceed predefined thresholds (e.g., if more than 10% of a dataset's core relationships have been altered).
- Strengthen ML Supply Chain Security: The talk highlights that both private and public datasets are vulnerable. Defenders must implement stringent security measures for private data (e.g., access controls, insider threat detection) and exercise extreme caution with public datasets or pre-trained models. Verifying the integrity of external data sources and understanding their provenance is paramount to prevent the "proliferation" of poison data into internal systems.
- Focus on Model Context and Intention: As Khodak emphasizes, "context and intention are key." Defenders need to have a clear understanding of what their ML models are intended to do. Any deviation from this intended purpose, even if the model's accuracy metrics remain superficially stable (as in the BadNets example), should be a red flag. Visualization tools help reveal these underlying shifts in behavior that might not be immediately apparent through traditional performance metrics.
- Proactive Monitoring for Structural Changes: The demonstration with GraphLeak showed that even if small-scale poisoning might not be immediately visible, targeted, complete poisoning of a data category leads to distinct structural changes (e.g., disappearance of nodes, altered edge thicknesses). Defenders should monitor for such structural changes in their data graphs, as these can indicate successful adversarial manipulation, even if the model's overall output hasn't yet led to catastrophic failure. This proactive monitoring helps in early detection before cascading effects take hold.
Key Takeaways
- Data poisoning is a critical and often subtle machine learning vulnerability: Attackers can manipulate training data through addition, modification, or deletion, leading to biased, unpredictable, or malicious model behavior that deviates from its intended purpose.
- Graph theory offers a powerful framework for visualizing data provenance and poisoning effects: Representing complex training data as nodes and edges allows for an intuitive, visual understanding of data relationships and how they change over time due to adversarial inputs.
- GraphLeak provides an intuitive, open-source tool for detecting data poisoning: The application enables side-by-side comparison of clean and poisoned graph representations of datasets, making subtle and significant data alterations visually apparent.
- Statistical risk analysis quantifies the impact of poisoning: GraphLeak incorporates risk ratings, informed by research indicating that as little as 10% poisoned data can significantly alter model behavior, providing a quantifiable measure of compromise alongside visual cues.
- Defenders must prioritize data provenance tracking and proactive monitoring: Implementing systems to track changes in datasets and using visualization tools like GraphLeak are crucial for identifying tampering, verifying data integrity, and understanding when a model's underlying context and intention have been corrupted.
- Understanding the ML supply chain is vital for security: Both private and public datasets are vulnerable, necessitating careful verification of data sources and a cautious approach to using pre-trained models to prevent the proliferation of poisoned data.
About the Speaker(s)
Maria Khodak is a dedicated Security Researcher and a PhD student at Dartmouth College. Her academic and research interests lie at the fascinating intersection of graph theory and cybersecurity, with a particular focus on machine learning and its associated security challenges. Her work, as demonstrated in this talk, often involves applying graph-based methodologies to analyze and visualize complex security vulnerabilities, including binary analysis and adversarial machine learning attacks like data poisoning. Khodak's research aims to demystify the inner workings of complex systems, such as large language models, through intuitive visual pathways, making sophisticated security concepts more accessible and actionable for defenders.
Reviews
Dr. Zero (Offensive Security Researcher) — WEAK
A decent educational intro to data poisoning with a working visualization tool, but this is fundamentally a student project demo rather than novel security research. GraphLeak is a neat idea for pedagogy, but the threat model is thin and the 'detection' claim doesn't hold up against real-world poisoning scenarios.
Heather Calloway (CISO) — SOLID
A reasonable early-stage research demo on visualizing ML data poisoning through graph representation. Conceptually interesting, but the tool isn't mature enough to change how security teams actually operate today. Worth watching if you're building ML security into your program roadmap, but not urgent.