From Idea to JEP: An OpenJDK Developer’s Journey to Improve Profiling
Johannes Bechberger
Gulaschprogrammiernacht 24 (GPN24) · Day 3 · ZKM Vortragssaal
Overview
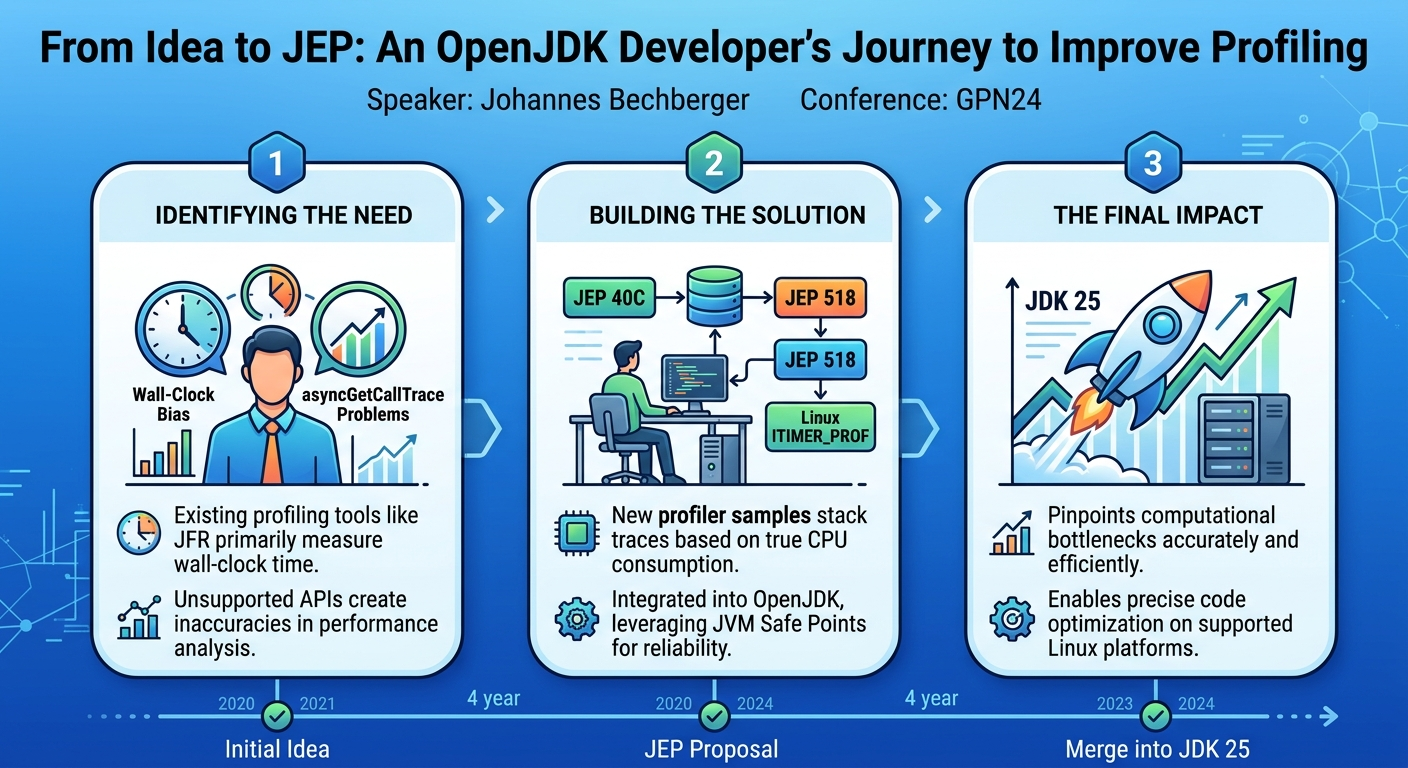
In this engaging GPN24 talk, Johannes Bechberger, a prominent OpenJDK contributor, takes the audience on a four-year journey detailing the development and integration of a new CPU time profiler into OpenJDK. The presentation highlights the critical need for accurate performance analysis in Java applications, moving beyond traditional wall-clock-based profiling to focus on actual CPU utilization. Bechberger, known for his work at SAP and contributions to OpenJDK, explains how this new profiler, integrated as JEP 40C and leveraging advancements from JEP 518, provides an unbiased and precise view of where computational resources are truly being consumed.
Key moments
- 0:54 Why profiling matters: a real-world application failure
- 7:45 Java Flight Recorder (JFR) features and wall-clock sampling issues
- 12:45 Personal journey to improve Java's profiling APIs
- 20:00 How JVM safe points work, including "segfaults on purpose"
- 28:00 Introducing the new CPU time profiler for accurate bottlenecks
- 31:00 JEP 40C for CPU time profiling merged into JDK 25
- 38:00 Enabling and configuring the new CPU time profiler (Linux only)
- 43:50 Q&A: Using Linux perf tool with Java applications
From Idea to JEP: An OpenJDK Developer’s Journey to Improve Profiling
Speakers: Johannes Bechberger
Conference: GPN24
YouTube: https://www.youtube.com/watch?v=ji43s8Ul12o
Overview
In this engaging GPN24 talk, Johannes Bechberger, a prominent OpenJDK contributor, takes the audience on a four-year journey detailing the development and integration of a new CPU time profiler into OpenJDK. The presentation highlights the critical need for accurate performance analysis in Java applications, moving beyond traditional wall-clock-based profiling to focus on actual CPU utilization. Bechberger, known for his work at SAP and contributions to OpenJDK, explains how this new profiler, integrated as JEP 40C and leveraging advancements from JEP 518, provides an unbiased and precise view of where computational resources are truly being consumed.
The talk not only delves into the technical intricacies of extending the Java Virtual Machine (JVM) with C++ code but also provides a rare glimpse into the complex, often arduous, process of proposing and implementing significant changes within the OpenJDK project. Bechberger shares personal anecdotes, illustrating the challenges of API design, community consensus-building, and navigating the demanding release cycles of Java. This new profiling capability is a significant step forward for developers seeking to optimize high-performance Java applications, offering unprecedented clarity into CPU-bound bottlenecks.
This work addresses long-standing limitations in Java profiling, particularly the inaccuracies inherent in wall-clock sampling and the unofficial nature of previous low-level profiling APIs. By providing a robust, officially supported, and CPU-centric profiling mechanism, Bechberger’s contributions empower developers to pinpoint and resolve performance issues with greater confidence and efficiency, ultimately leading to more optimized and responsive Java systems.
Background
▶ Watch: Why profiling matters: a real-world application failure (0:54)
The journey into improving Java profiling begins with a fundamental problem: identifying where an application spends its time. Johannes Bechberger illustrates this with a personal anecdote from a community event during Corona, where a seemingly simple application for an interactive quiz became severely overloaded. His initial design, storing all data in a JSON file and relying on the file system for synchronization, quickly proved inadequate under load. This experience underscored the timeless wisdom (and common misinterpretation) of Donald Knuth’s quote: "Premature optimization is the root of all evil." Bechberger emphasizes the longer, more critical part of the quote: "we should not pass up our opportunities in the critical 3%. A good programmer will not be lured into complacency by such reasoning. He will be advised to look carefully at the critical code but only after that code has been identified." The crucial question, then, is how to identify that critical code, and the answer lies in profilers.
Java offers various profiling tools, broadly categorized into external and built-in options. External profilers, such as VisualVM and async-profiler, often rely on unofficial or deprecated APIs. A prominent example is asyncGetCallTrace, a method introduced in 2002 by Sun Microsystems for their FordAnalyzer profiler. Although it was removed from official exports three months later, it remained accessible and became the backbone for many major profilers until recently. However, asyncGetCallTrace is unofficial, unsupported, lacks comprehensive testing, and misses crucial information for robust profiling.
On the built-in side, the Java Flight Recorder (JFR), open-sourced in 2018, is a powerful tool. JFR is simple to use, works across all platforms (including Windows), and offers an extensive array of 126 events, ranging from object allocations to compiler inlining details. It even supports custom events, as demonstrated by its use in Minecraft. Despite its strengths, JFR has a significant limitation: it's primarily a wall-clock profiler. JFR typically captures five stack traces every 100 or 20 milliseconds by suspending a non-blocked Java thread, walking its stack, and then resuming it. This approach suffers from several issues: an inconsistent error rate (e.g., getting four samples instead of five without notification), and a linear scaling of the effective sampling period with the number of threads. This means there's no clear, consistent relationship between CPU time and the number of samples, making it difficult to reason about true computational hotspots.
Bechberger's involvement stems from his role at SAP, a major contributor to OpenJDK. As a full-time open-source developer, he initially aimed to improve the existing, problematic APIs. His early attempts, like the "asynchronous stack trace VM API" proposed in April 2022, sought to define an efficient and reliable API for asynchronous stack trace collection, providing richer information such as bytecode index, method ID, inline status, compilation level, and even C++ frames. However, the path to integrating such fundamental changes into OpenJDK is fraught with challenges, including API design complexities and the need to gain consensus from a diverse community of contributors. This led him to explore more robust and officially supported alternatives.
A core concept underlying robust profiling is the safe point. A safe point is a specific location in a program where the JVM can safely perform operations that require all threads to be in a well-defined, consistent state, such as garbage collection. Threads explicitly check at these points (e.g., at method entry/exit, loopback edges) if they should yield control. Interestingly, safe points are often implemented using an intentional segfault mechanism: threads attempt to read from a write-protected memory page. If the page is unprotected, execution continues swiftly; if protected, a segfault occurs, allowing the JVM to handle it, bring the thread to a safe point, and then resume. While efficient in the best case, this intentional segfaulting can confuse debuggers. However, traditional "safe from bias" profilers that only sample at safe points are, as Nitsan Wakart puts it, "tricksy snicksy" because they inherently introduce bias by only observing the system at predetermined intervals, missing activity between them. The goal, therefore, was to achieve an unbiased, yet safe, asynchronous stack walking mechanism.
Key Findings
▶ Watch: Personal journey to improve Java's profiling APIs (12:45)
The central discovery and contribution of Johannes Bechberger's work is the development and integration of a new CPU time profiler into OpenJDK, fundamentally changing how Java applications can be profiled for computational performance. This profiler provides an unbiased view of an application's CPU usage by sampling stack traces based on the actual CPU time consumed by a thread, rather than elapsed wall-clock time.
This innovation directly addresses the limitations of previous profiling methods, particularly JFR's wall-clock-based sampling and the problematic asyncGetCallTrace API. By focusing on CPU time, the new profiler ensures that the effective sampling period remains constant regardless of the number of threads running, eliminating the linear scaling issue seen with JFR. This consistency makes it significantly easier to interpret profiling results, as the number of samples directly correlates with the amount of CPU time spent in a particular method or code path.
The new CPU time profiler was introduced as an experimental event under JEP 40C: CPU Time Profiling and was merged into JDK 25. Its implementation also benefits from the broader improvements in JFR's sampling mechanism, specifically JEP 518: Cooperative Sampling for JFR, which enables JFR to sample entire stacks reliably at safe points without needing crash protection wrappers. Together, these JEPs provide a robust, officially supported, and highly accurate tool for identifying and resolving computational bottlenecks in Java applications. This marks a significant advancement for performance engineering in the Java ecosystem.
Technical Deep Dive
▶ Watch: Introducing the new CPU time profiler for accurate bottlenecks (28:00)
The core of the new CPU time profiler lies in its ability to accurately measure and attribute CPU time to specific code paths, a departure from wall-clock-based sampling. This is achieved primarily through the use of ITIMER_PROF on Linux, a system timer that delivers a signal to a thread after a specified amount of CPU time has elapsed. For instance, the profiler can be configured to send a signal every 10 milliseconds of CPU time consumed by a thread.
When an ITIMER_PROF signal is received, a signal handler is invoked within the context of the thread that triggered the timer. Crucially, within this signal handler, the profiler captures a "tip of the stack trace." This minimal information includes the program counter (PC), stack pointer (SP), and function pointer (FP). This limited capture is vital because complex operations like memory allocation are unsafe within a signal handler. The captured tip is then pushed into a thread-local bounded queue. The queue is bounded to prevent excessive memory usage and potential allocation failures in the signal handler; if the queue fills up, samples might be lost, which is explicitly reported via a samples lost event.
The challenge then becomes how to reconstruct a full, meaningful stack trace from these minimal tips, especially given the dynamic nature of the JVM (e.g., class unloading, just-in-time compilation). The solution leverages safe points. As discussed, safe points are moments when a Java thread is in a well-defined state, making it safe to perform operations like resolving method information.
The stack walking process involves two main phases:
- Signal Handler Stack Walking: In the signal handler, the profiler walks the native stack until it hits the first non-inlined Java frame. Inlined frames are optimized by the JIT compiler and don't correspond to distinct stack frames in the traditional sense, so they are not resolved at this stage. The information collected (PC, SP, FP) is then enqueued.
- Asynchronous Stack Reconstruction at Safe Points: Periodically, and specifically when a thread reaches a safe point, the profiler can safely process the accumulated tips from its thread-local queue. Because the thread is at a safe point, methods cannot be concurrently unloaded or modified, allowing for reliable resolution of method IDs, bytecode indices, and other detailed information. From the first full Java frame, the entire Java stack can then be walked backward to reconstruct the complete call chain.
A particular challenge arises when Java code calls into native functions (e.g., database drivers, network operations). During the execution of native code, a thread might not reach a Java safe point for an extended period. To address this, the profiler employs a clever mechanism: at the beginning of a native method call, a safe point is typically encountered. If a thread is observed to be in native code, a separate "walking" thread can be signaled to process the samples in that thread's queue. To ensure consistency and avoid race conditions, at the safe point marking the end of the native call (before Java code resumes), the original thread waits for the walking thread to finish processing its queue. This strategy minimizes sample loss and provides a more complete picture of execution, even across native boundaries.
The new CPU time profiler is exposed as an experimental JFR event via JEP 40C: CPU Time Profiling. It complements JEP 518: Cooperative Sampling for JFR, which enhances JFR's ability to sample full stack traces reliably at safe points, eliminating the need for complex crash protection wrappers previously used in JFR. This cooperative sampling ensures that the JVM is in a stable state when stack traces are walked, improving the robustness and accuracy of profiling data. The technical implementation, while conceptually elegant, involved approximately 2,000 lines of C++ code and several years of iterative development, testing, and debugging, including numerous "segfaults on purpose" during development.
A critical limitation, however, is that this CPU time profiling is currently only available on Linux. This is because operating systems like macOS or FreeBSD do not provide the necessary ITIMER_PROF mechanism that allows for CPU time-related signals on a per-thread basis. These systems typically offer only process-wide CPU time measurements, which are insufficient for granular thread-level profiling. This platform specificity means developers on other operating systems cannot currently leverage this powerful new profiling capability.
Demo / Proof of Concept
▶ Watch: JEP 40C for CPU time profiling merged into JDK 25 (31:00)
While the talk did not feature a live coding demo, Johannes Bechberger effectively presented a clear proof-of-concept scenario to illustrate the stark difference between the new CPU time profiler and traditional wall-clock profilers like the default JFR.
The scenario involved a simple server setup with two types of requests:
- Fast Requests: These return in 100 milliseconds.
- Slow Requests: These return after 1 second, simulating a blocking operation or I/O wait.
A client was designed to make 10 fast requests followed by 1 slow request. The intuitive expectation is that the 10 fast requests, despite being individually shorter, would collectively consume more CPU time if they involve actual computation, or at least be more prominent if the slow request is primarily waiting.
With a default wall-clock profiler (like the original JFR), the results would show similar numbers of samples for both the fast and slow requests. This is because the wall-clock profiler samples based on elapsed time, regardless of whether the thread is actively computing or waiting. A 1-second slow request, even if it spends 990ms waiting, would still register a significant number of samples because 1 second of wall-clock time has passed.
In contrast, when the new CPU time profiler is applied to this same scenario, the results are dramatically different. The "slow request" effectively disappears from the flame graph or shows a negligible number of samples. This is because the slow request spends most of its 1-second duration in an I/O wait state, consuming very little actual CPU time. The CPU time profiler accurately reflects this, showing that the bulk of the CPU activity comes from the 10 fast requests. This capability is invaluable for identifying true computational bottlenecks, distinguishing them from I/O-bound or waiting states that might otherwise obscure the real performance culprits in a wall-clock profile.
Bechberger also briefly mentioned his own open-source profiler plugin for IntelliJ, which fully integrates with the IDE to view JFR data. While not a direct part of the demo, this tool serves as a practical example of how developers can visualize and analyze the rich data generated by JFR, including the new CPU time profiling events.
Defensive Implications
▶ Watch: Q&A: Using Linux perf tool with Java applications (43:50)
The introduction of the new CPU time profiler in OpenJDK 25 (JEP 40C) has significant implications for developers and system administrators focused on performance tuning and security. Defenders should leverage this new capability to gain deeper insights into the computational behavior of their Java applications.
First and foremost, it's crucial to understand how to enable and configure this experimental feature. The profiler is not enabled by default. To activate it, developers need to add the JVM flag jdk.cpu.time.sample.enable=true. The sampling interval can be configured using the CPUTimeInterval parameter. However, a fixed interval like "10 milliseconds" can lead to an overwhelming number of events on systems with many cores (e.g., 10,000 events per second on a 100-core system). Therefore, the profiler offers dynamic adaptation, computing an upper bound based on the number of available cores to manage event volume effectively.
Defenders should actively incorporate CPU time profiling into their performance analysis workflows, especially for applications exhibiting high CPU usage or unexpected latency. By focusing on CPU-bound work, they can differentiate between actual computational bottlenecks and issues caused by I/O waits, garbage collection pauses, or thread contention that might manifest similarly in wall-clock profiles. This precision allows for more targeted optimization efforts, such as algorithm improvements, efficient data structures, or better concurrency management.
When analyzing the output, defenders should pay close attention to the detailed information provided:
- Stack traces: Pinpoint the exact methods consuming CPU cycles.
- Thread information: Identify which threads are CPU-intensive.
- Sampling period from the OS: Understand the actual interval between signals.
- Samples lost event: Be aware if the internal queues filled up, indicating potential under-sampling in very busy periods. This helps in understanding the completeness of the data.
It's important to remember that this feature is currently marked as experimental. This implies that its API or behavior might change in future JDK versions, and developers should monitor OpenJDK release notes for updates. Furthermore, the profiler's current Linux-only availability means that profiling efforts on other operating systems (macOS, Windows) will still need to rely on alternative tools or older JFR wall-clock methods, which might not offer the same level of CPU-centric accuracy. Organizations deploying Java applications on Linux environments should prioritize adopting this tool for their performance diagnostics.
Finally, this work underscores the broader importance of profiling as a fundamental defensive tool. Just as debugging and testing are integral, profiling helps identify hidden performance vulnerabilities that could lead to denial-of-service, resource exhaustion, or simply inefficient resource utilization, impacting operational costs and user experience. By understanding and utilizing advanced profiling techniques like the new CPU time profiler, defenders can build more resilient, performant, and secure Java applications.
Key Takeaways
- Unbiased CPU Time Profiling: OpenJDK 25 introduces a new CPU time profiler (JEP 40C) that samples stack traces based on actual CPU consumption, providing an unbiased view of computational bottlenecks, unlike traditional wall-clock profilers.
- Addresses Prior Limitations: This new profiler resolves critical issues with existing Java profiling tools, such as the inaccuracies of wall-clock sampling (e.g., JFR's linear scaling with threads) and the unsupported nature of the
asyncGetCallTraceAPI. - Leverages
ITIMER_PROFand Safe Points: The implementation relies on Linux'sITIMER_PROFfor precise CPU-time-based signaling and uses JVM safe points for robust and safe reconstruction of full Java stack traces, even across native method calls. - Crucial for Performance Optimization: By accurately identifying methods consuming the most CPU time, developers can make highly targeted optimizations, leading to more efficient, responsive, and resource-friendly Java applications.
- Linux-Only Availability: Due to operating system-specific timer capabilities, the new CPU time profiler is currently limited to Linux environments.
- Open-Source Development Journey: The integration of this feature highlights the extensive, multi-year process of contributing to OpenJDK, involving complex API design, community consensus, rigorous testing, and significant technical challenges.
About the Speaker(s)
Johannes Bechberger is an OpenJDK developer at SAP, a global software corporation. He is recognized as a significant contributor to the OpenJDK project, with SAP being the third-largest contributor overall. His work at SAP involves core Java development, including maintaining and developing ports of Java for various platforms such as PowerPC, S390, and AIX. Bechberger pursued a PhD in computer science at KIT before dedicating himself full-time to open-source development within OpenJDK. He is a prolific speaker at technical conferences like GPN and FOSDEM, sharing his deep expertise in JVM internals and profiling. Bechberger is also the creator of an open-source profiler plugin for IntelliJ that integrates with JFR data. His presentations often blend technical rigor with personal anecdotes, illustrating the challenges and rewards of low-level JVM development.
Reviews
Dr. Zero (Offensive Security Researcher) — STRONG ACCEPT
Solid JVM internals talk that walks through real contribution work—signal handlers, safe points, the whole stack-walking dance. Bechberger clearly did the work himself and explains the ugly bits. Not paradigm-shifting, but this is how good engineering talks should look.
Heather Calloway (CISO) — SOLID
Deep JVM internals work on CPU time profiling — technically solid, well-delivered, but firmly in the weeds of OpenJDK contribution. No governance angle, no security dimension. If you're not running a Java shop with performance-critical workloads on Linux, this isn't for you.