The Anatomy of Windows Telemetry Part 2
Tillmann Oßwald (Windows System Analyst · ERNW), Dominik Phillips (Windows System Analyst · ERNW), Maximilian Winkler (Head of Section, Mobile Incident Response Team · BSI)
TROOPERS23 · Day 2 · Attack & Research · Attack & Research
Overview
In "The Anatomy of Windows Telemetry Part 2," presented at TROOPERS, Tillmann Oßwald, Dominik Phillips, and Maximilian Winkler unveil the intricate mechanisms and actual data transmitted by Windows 10/11 telemetry. Building upon prior research presented in 2018, this talk shifts focus from the architectural overview to a deep dive into the specific data sent from client systems to Microsoft's diagnostic data management services. The speakers, representing ERNW and the German Federal Office for Information Security (BSI), highlight the significant privacy and security implications for organizations and individuals.
Key moments
- 0:00 Introduction to Windows Telemetry research project
- 4:00 Deciding to monitor telemetry data via ETW
- 12:00 Custom scanning to identify embedded ETW providers
- 28:00 Demonstrating user activity tracking through Edge events
- 32:00 Correlating telemetry for deep user behavior insights
- 34:00 Framework for organizational decisions on Windows Telemetry
- 37:30 German federal government's decision to disable telemetry
- 40:30 Q&A: Microsoft's telemetry updates and documentation
The Anatomy of Windows Telemetry Part 2
Speakers: Tillmann Oßwald (Windows System Analyst, ERNW); Dominik Phillips (Windows System Analyst, ERNW); Maximilian Winkler (Head of Section, Mobile Incident Response Team, BSI)
Conference: TROOPERS
YouTube: https://www.youtube.com/watch?v=JeXtnw6CW4Y
Overview
In "The Anatomy of Windows Telemetry Part 2," presented at TROOPERS, Tillmann Oßwald, Dominik Phillips, and Maximilian Winkler unveil the intricate mechanisms and actual data transmitted by Windows 10/11 telemetry. Building upon prior research presented in 2018, this talk shifts focus from the architectural overview to a deep dive into the specific data sent from client systems to Microsoft's diagnostic data management services. The speakers, representing ERNW and the German Federal Office for Information Security (BSI), highlight the significant privacy and security implications for organizations and individuals.
The research, conducted as part of the larger Sisyphos Win 10 project, aimed to provide an independent, comprehensive understanding of Windows 10's security-critical functionalities, including telemetry, in the absence of detailed public documentation. The core objective of this specific work was to identify, intercept, and analyze the raw telemetry data leaving a Windows system, offering unparalleled insight into the extent and nature of information Microsoft collects. This detailed analysis empowers organizations to make informed decisions regarding their telemetry policies, balancing functionality with privacy and compliance requirements.
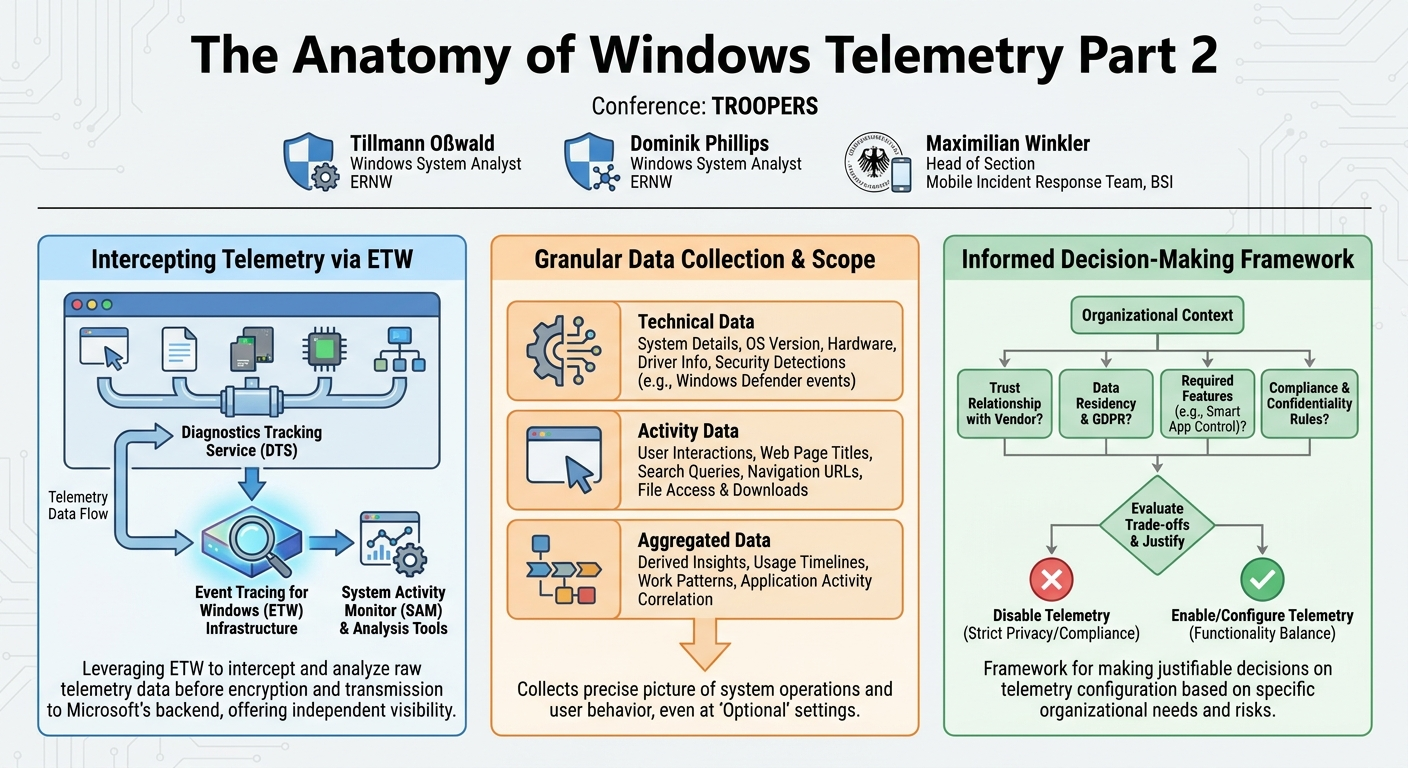
The findings demonstrate that Windows telemetry can construct a remarkably precise picture of system usage, user activity, and network environment, far beyond general system health metrics. Through a sophisticated methodology leveraging Windows' own Event Tracing for Windows (ETW) infrastructure, the team successfully captured and categorized a vast array of transmitted data, ranging from technical system details to highly granular user interactions within applications like the Edge browser. This talk provides critical information for security professionals, privacy advocates, and IT administrators seeking to understand and manage their Windows environments effectively.
Background
▶ Watch: Introduction to Windows Telemetry research project (0:00)
The journey into Windows telemetry began with the Sisyphos Win 10 project, a collaborative effort between ERNW and the BSI. The project's overarching goal was to gain a deep, independent understanding of Windows 10's internal architecture and functionality, particularly concerning security-critical components like TPM usage, Device Guard, PowerShell, and driver management. Crucially, the focus was not on finding implementation vulnerabilities but on comprehending the design and operation of these often-undocumented internal systems.
Initial research, presented at TROOPERS 2018, established a foundational understanding of the Windows telemetry architecture. This simplified model identified two primary components: the Diagnostics Tracking Service (DTS), also known as the "Connected User Experience and Telemetry Service," implemented in diagtrack.dll. This service accesses data from two main sources: the Event Tracing for Windows (ETW) infrastructure (primary) and direct calls to executables and API functions (secondary). Communication with the backend involves pushing telemetry information to Microsoft's diagnostic data management services and fetching configuration updates. This network communication occurs over HTTP, with messages compressed and encrypted within a TLS tunnel that utilizes certificate pinning.
Despite the architectural clarity achieved in 2018, a significant "blind spot" remained: the actual content of the data being transmitted. The researchers posed a critical question: "How can we, with little effort, monitor and observe what is going on on the wire, or what is being sent out to the backend?" Directly intercepting network traffic proved challenging due to the TLS encryption and certificate pinning, which would require substantial effort to bypass. Consequently, the team opted for an ingenious approach: mirroring Microsoft's own data collection method. They decided to use the ETW infrastructure itself to monitor the DTS, effectively observing the telemetry service from within the local system, prior to encryption and transmission. This decision laid the groundwork for the detailed data analysis that forms the core of this presentation.
Key Findings
▶ Watch: Custom scanning to identify embedded ETW providers (12:00)
The central finding of this research is the successful, reliable, and comprehensive interception and analysis of the raw, unencrypted telemetry data destined for Microsoft's backend. By leveraging the Windows Event Tracing for Windows (ETW) framework, the team managed to tap into the same data streams that the Diagnostics Tracking Service (DTS) uses, providing an unprecedented look into the types and volume of information being collected.
The sheer volume of telemetry data is a significant revelation. Over a single week of monitoring a "normal use" virtual machine, the researchers accumulated 300,000 events from the identified telemetry provider. Among these, approximately 1,000 events were directly related to the actual transmitted telemetry data, with peaks reaching up to 800 events per minute. This high volume underscores the continuous and granular nature of data collection.
The intercepted telemetry data was broadly categorized into three types:
- Technical Data: Information about the machine, operating system, hardware, and installed software. Examples include network trace routes, Windows Defender alerts (e.g., detecting
mimikatz.exe), Bluetooth driver details, and OS version information. This data allows Microsoft to infer system configurations and potential security threats. - Activity Data: Direct reflections of user actions and interactions with applications. This category proved particularly revealing, capturing details such as web page titles visited, search queries (e.g., "61st are formed search"), navigation URLs (including specific BSI project pages), clicked links, downloaded files (e.g., PDFs), and the local file paths of opened documents. This level of detail enables Microsoft to reconstruct precise user behavior.
- Aggregated Data: Insights derived from combining multiple individual records. By correlating different telemetry events, the researchers demonstrated the ability to build a comprehensive timeline of user activity. For instance, combining application usage statistics, user login events, and browser activity logs allowed them to reconstruct a user's "day in the life," including work patterns, breaks, and specific online activities. This aggregation capability allows Microsoft to gain profound insights into how systems are used and for what purposes.
Crucially, the research confirmed that even with telemetry set to "Optional" (Microsoft's highest level of data transmission for non-diagnostic purposes), a vast amount of potentially sensitive information is still collected. The ability to monitor this data independently, without relying on vendor documentation, empowers organizations to make truly informed decisions about their telemetry configurations and the associated privacy and compliance risks.
Technical Deep Dive
▶ Watch: Correlating telemetry for deep user behavior insights (32:00)
The core of the research methodology revolved around intercepting Windows telemetry data using the operating system's native Event Tracing for Windows (ETW) infrastructure. This approach was chosen over network analysis due to the challenges posed by TLS encryption and certificate pinning, which would have required significant effort to bypass. ETW offers a well-designed, high-performance, and reliable data collection mechanism.
ETW Architecture and Challenges:
ETW consists of three main components:
- Providers: Entities that write telemetry data (e.g.,
diagtrack.dll). - Collectors: Entities that receive and store ETW events.
- Controllers: Used to manage tracing sessions (e.g., starting/stopping, attaching providers).
While ETW provides a robust framework, a significant challenge arises when dealing with third-party or undocumented providers: the lack of knowledge about the data layout and schema. Without explicit documentation, understanding what data is being sent by a given provider requires extensive reverse engineering.
ETW Provider Discovery:
Standard Microsoft tools for ETW provider discovery typically only provide a GUID and a name, lacking the crucial link to the actual binary where the provider is implemented. This limitation is problematic for targeted analysis within a specific process or component. To overcome this, the researchers developed a novel scanning approach. Instead of relying on runtime registration or registry entries, they directly scanned binaries for metadata artifacts indicative of ETW capabilities.
- This approach requires deep knowledge of how different ETW provider types are implemented in binaries. For instance, TLG providers (a specific type of ETW provider used extensively in Windows telemetry) store their metadata in the read-only section, identifiable by specific magic keys and headers, followed by "event plots" describing event layouts.
- A custom tool, developed during the project, was used for this scanning, offering broader coverage of ETW provider types compared to other public tools (e.g., Matt Graeber's tool, which focuses primarily on TLG providers).
- Applying this tool to
diagtrack.dll, the core Telemetry service library, revealed 11 embedded ETW providers responsible for over 1,000 different records. This confirmeddiagtrack.dllas a rich source of telemetry events.
Data Extraction and Interpretation:
Once providers were identified, the next step was to extract and interpret their metadata. The custom tool could extract details like record names, field names, and data types. However, this metadata only provides the layout (e.g., "this field is a string"); it does not reveal the concrete content of the data (e.g., "this string contains a JSON payload").
- To understand the actual data, static and dynamic analysis were essential. For example, the
AsimovUploadPersistEventrecord, found within a TLG provider, was discovered to contain an ETW dataset formatted as a JSON string. The codename "Asimov" was identified as Microsoft's internal designation for telemetry data. - The researchers emphasized that simply identifying a record name (e.g.,
AsimovUploadPersistEvent) as "upload persist event" was not sufficient to confirm it represented transmitted data.
Validation of Transmitted Data:
To be 100% certain that an ETW event accurately reflected data being sent to Microsoft, the entire telemetry processing chain had to be evaluated:
- An event arrives at the Diagnostics Tracking Service (DTS).
- It is converted into a JSON format.
- A "write operation" occurs, often involving the TLG provider.
- The data is compressed.
- It is loaded into an internal database.
- The data is then read from the database and ultimately sent to the Microsoft backend.
By meticulously tracing this entire sequence through static and dynamic analysis, the team confirmed that the AsimovUploadPersistEvent indeed reflects the data transmitted to Microsoft. This rigorous validation process ensures the accuracy of their findings, making ETW a powerful and reliable observation point for Windows telemetry.
Demo / Proof of Concept
▶ Watch: Framework for organizational decisions on Windows Telemetry (34:00)
The practical demonstration of the research involved a sophisticated analysis infrastructure designed to capture, process, and visualize the vast streams of telemetry data.
Analysis Infrastructure:
- Test Systems: Two virtual machines running Windows 10 and Windows 11, configured with telemetry set to "Optional" (the highest level of data transmission). These VMs were used for typical daily activities like browsing, development, and document editing to simulate real-world usage.
- Capture Tool: The project developed a custom tool called System Activity Monitor (SAM). SAM is designed to start and stop ETW tracing sessions, record events, and enrich them with further metadata. It supports filtering during collection and meets stringent performance requirements, logging events into the Windows Event Log for easy integration. The speakers noted that existing tools like xperf or Windows Performance Analyzer (WPA) had limitations for their specific needs.
- Data Forwarding: Events captured by SAM were forwarded via Winlogbeat to a dedicated backend system.
- Backend Analysis: An ELK stack (Elasticsearch, Logstash, Kibana) was used for data processing and visualization. Logstash performed further processing, Elasticsearch indexed the records, and Kibana provided a powerful interface for searching and filtering the extensive dataset. This decoupled capture and analysis approach ensures flexibility and scalability.
Telemetry Record Structure:
A typical telemetry record, as intercepted by their methodology, consists of three conceptual parts:
- Header: Always present, containing a version number (which can vary, e.g., v3 to v4 for analysis packages), the ETW provider name (e.g.,
Microsoft-Windows-Bluetooth-Host-Local-Driver-Information), and a timestamp indicating when the record was generated for telemetry. - Extension Fields: These fields vary but consistently include operational OS version information, a "good identifier" (incrementing with boots), device class (e.g., "desktop"), a device GUID, an application identifier (the source application), and a user GUID.
- Data Field: This is the most specific and interesting part, containing the actual telemetry payload relevant to the originating record.
Categorized Data Examples:
- Technical Data:
- Trace Route Information: An event showing parts of a trace route, including network hops and the service provider (
filescom), demonstrating collection of network topological data. Notably, some hops were omitted, suggesting either filtering or aggregation. - Windows Defender Event: An event indicating that Windows Defender identified
mimikatz.exeon the system and sent a report via telemetry. This highlights the collection of security-related detection data. - Bluetooth Driver Information: A detailed event from the
Microsoft-Windows-Bluetoothprovider, including the driver's INF file (OEM4.inf), manufacturer (Intel Corporation), description (Wireless Bluetooth(R)), device instance IDs, and installation time. This illustrates the depth of hardware and driver information collected.
- Activity Data:
- Edge Browser Activity: A series of events showcasing granular user interaction:
- A page title event: "61st are formed search" (suggesting a Bing search query).
- A navigation event: From
bing.comtobsi.bund.de/DE/themen/cybersicherheit/…/sisyphos_node.html(the BSI Sisyphos project page). - A click event on a link within that page.
- A download event for a PDF file from the page.
- An open event for the downloaded PDF, revealing its local path.
This sequence demonstrated the ability to reconstruct a detailed user journey and specific actions within the browser and local filesystem.
- Aggregated Data:
- Events per Application: A logarithmic scale graph showing the number of events generated by various applications (e.g., Edge,
logonui.exe, PowerPoint, Visual Studio Code). A linear scale graph revealed thatsvchost.exeand Edge browser were by far the most active telemetry producers, indicating Microsoft's strong interest in their own services and flagship browser. - User "Day in the Life" Timeline: A powerful aggregation example correlated total telemetry records (blue line), user logins (
logonui.exeevents, red lines), and Microsoft Edge events (green dashed lines) over a day. This visualization allowed the speakers to reconstruct a user's workday, including login times, periods of intense browsing, breaks, and other activities. This demonstrated how Microsoft could gain deep insights into work patterns, application usage, and overall system engagement, even extrapolating user presence and activity based on telemetry spikes. The creativity in correlating diverse data points is key to unlocking such comprehensive user profiles.
Defensive Implications
▶ Watch: Q&A: Microsoft's telemetry updates and documentation (40:30)
The analysis presented unequivocally demonstrates that Windows telemetry, even at its "Optional" setting, transmits a substantial volume of data capable of painting a highly precise picture of system operations and user behavior. This level of insight carries significant defensive implications for organizations.
The central takeaway for defenders is not merely what data is transmitted, but the imperative to make an informed decision about telemetry usage and to be able to justify that decision. Telemetry is not a simple "black or white" or "zero or one" choice; rather, it often involves nuanced trade-offs. For instance, certain Windows features, such as Smart App Control, explicitly require telemetry to be enabled to function. Organizations must weigh the benefits of such features against their privacy and compliance obligations.
To guide this decision-making process, the speakers proposed a framework based on answering key questions relevant to an organization's specific context:
- Trust Relationship with Vendors: Is there a special trust relationship with Microsoft (a US-based vendor under US regulations)?
- Data Residency: Where does the collected telemetry data reside (e.g., within or outside specific geographical boundaries)?
- Regulations in Place: Are there regulatory frameworks, such as the GDPR in the EU, that dictate how personal data must be handled?
- Required Features: Are there specific Windows features, like Smart App Control, that are critical to the organization's operations and depend on telemetry?
- Special Contracts: Are there existing IT system lease agreements or other contracts that restrict configuration changes?
- Compliance Rules: What internal compliance rules and directives (e.g., restricted information handling) are in place?
- Confidentiality/Integrity Requirements: What are the organization's requirements regarding the confidentiality and integrity of its data?
Applying this framework to the German federal government use case, the speakers illustrated how these questions lead to a clear decision:
- Trust: No special trust relationship with a US vendor.
- Residency: Data usually resides outside Germany.
- Regulations: GDPR applies.
- Features: No critical features are lost by disabling telemetry.
- Contracts: No restrictive contracts.
- Confidentiality/Integrity: Very strict requirements for processing restricted information, which must not leave the network. Telemetry cannot guarantee this.
- Compliance: Strict rules regarding restricted information handling.
For the German federal government, these considerations collectively lead to the conclusion that telemetry must be deactivated. However, it is crucial to understand that this picture can be entirely different for other organizations.
The methodology and the System Activity Monitor (SAM) tool developed during the project are invaluable resources for defenders. SAM allows organizations to independently look into their own telemetry data, understand its content, and thus gain a better feeling for what is being transmitted. This empowers them to make informed, justifiable decisions about telemetry configuration, whether that involves complete deactivation, selective disabling of certain event types (e.g., browser events), or accepting the trade-offs for specific functionalities. SAM's utility extends beyond telemetry, providing a general-purpose tool for monitoring any activity within the ETW infrastructure, offering broader visibility into system behavior.
Key Takeaways
- ETW as an Invaluable Monitoring Tool: The Windows Event Tracing for Windows (ETW) infrastructure is a powerful, yet often overlooked, mechanism for independently monitoring and analyzing internal operating system activities, including telemetry data, before it leaves the client system.
- Deep Insight into User and System Activity: Windows telemetry, even at "Optional" settings, collects highly granular data, capable of reconstructing precise user behavior (e.g., web browsing, file downloads, application usage) and detailed system states (e.g., hardware information, network paths, security detections).
- Significant Data Volume: The sheer volume of telemetry data, with hundreds of thousands of events per week and hundreds of transmitted events per minute, underscores the continuous and comprehensive nature of Microsoft's data collection efforts.
- Informed Decision-Making is Crucial: Organizations must move beyond a simple "on/off" approach to telemetry. A structured framework, addressing key questions about trust, regulations (e.g., GDPR), data residency, and functional requirements, is essential for making justifiable decisions about telemetry configuration.
- Project Tools Enhance Visibility: The custom System Activity Monitor (SAM) tool developed during the project provides a critical capability for organizations to independently inspect and understand the actual content of their transmitted telemetry data, aiding compliance and risk management.
- Trade-offs Between Functionality and Privacy: Certain Windows features, such as Smart App Control, require telemetry to be enabled, forcing organizations to balance the benefits of these features against their privacy requirements and compliance obligations.
About the Speaker(s)
Maximilian Winkler serves as the Head of Section for the Mobile Incident Response Team at the German Federal Office for Information Security (BSI). His work involves overseeing and responding to security incidents, particularly in mobile environments, and contributing to projects like Sisyphos Win 10, which aims to provide independent security analysis of Windows 10.
Dominik Phillips is a Windows System Analyst at ERNW, a company specializing in IT security consulting and analysis. His expertise lies in deep-diving into Windows internal mechanisms, as demonstrated by his contributions to understanding and analyzing the complex architecture of Windows telemetry.
Tillmann Oßwald is also a Windows System Analyst at ERNW. He played a significant role in the technical implementation and analysis aspects of the Sisyphos Win 10 project, focusing on identifying, extracting, and interpreting the raw telemetry data from Windows systems.
Reviews
Dr. Zero (Offensive Security Researcher) — SOLID
Oßwald, Phillips, and Winkler didn't just complain about Windows privacy—they ripped the lid off DiagTrack. By bypassing pinned TLS and parsing upstream ETW providers, they proved exactly what Microsoft is vacuuming up. It's rigorous, highly practical RE work that gives defenders the raw data to justify their GPO configs.
Heather Calloway (CISO) — MUST SEE
The BSI and ERNW did the hard work of intercepting and decoding Windows telemetry before it hits the TLS tunnel. They proved that "Optional" telemetry functions as a granular user behavior logger, exfiltrating local file paths, search queries, and daily work schedules. This is required reading for any CISO managing a Windows fleet under GDPR or strict data residency requirements.