Your Security Dashboard is Lying to You: The Science of Metrics
Aram Hovsepyan (CEO · Codif)
Swiss Cyber Storm 2025 · Day 1 · Arena
Overview
In his compelling talk at Swiss Cyber Storm, Aram Hovsepyan, CEO of Codif, challenged the pervasive issue of misleading security dashboards and ineffective metrics within organizations. Titled "Your Security Dashboard is Lying to You: The Science of Metrics," Hovsepyan, who holds a PhD from the University of Leiden with a specialization in security metrics, exposed the fundamental flaws in how many companies measure and report their security posture. He argued that just as a fitness tracker might report 10,000 steps without reflecting actual fitness improvement, many corporate security dashboards present seemingly impressive numbers that fail to provide meaningful insights or drive effective decision-making.
Key moments
- 0:47 Problem with corporate security dashboards and bad metrics
- 4:20 Introduction to Goal Question Metric (GQM) framework
- 11:20 Understanding metric precision and reliability
- 16:00 Exploring different types of metric validity
- 23:50 Understanding measurement scales and avoiding flawed math
- 27:00 Summary: Valid, precise, reliable metrics
- 28:20 Why do organizations stick with bad dashboards?
- 29:20 The overlooked value of qualitative metrics
Your Security Dashboard is Lying to You: The Science of Metrics
Speakers: Aram Hovsepyan, CEO, Codif
Conference: Swiss Cyber Storm
YouTube: https://www.youtube.com/watch?v=jyEtigiIN-A
Overview
In his compelling talk at Swiss Cyber Storm, Aram Hovsepyan, CEO of Codif, challenged the pervasive issue of misleading security dashboards and ineffective metrics within organizations. Titled "Your Security Dashboard is Lying to You: The Science of Metrics," Hovsepyan, who holds a PhD from the University of Leiden with a specialization in security metrics, exposed the fundamental flaws in how many companies measure and report their security posture. He argued that just as a fitness tracker might report 10,000 steps without reflecting actual fitness improvement, many corporate security dashboards present seemingly impressive numbers that fail to provide meaningful insights or drive effective decision-making.
The core of Hovsepyan’s presentation is a scientific deep dive into the properties of good metrics, offering attendees a critical lens through which to evaluate their own security measurement practices. He introduced established frameworks and concepts such as the Goal-Question-Metric (GQM) framework, along with essential qualities like precision, reliability, and validity, and the crucial understanding of measurement scales. This talk is vital for anyone involved in cybersecurity, from practitioners to C-suite executives, who rely on metrics to understand, communicate, and improve their security programs, highlighting that a lack of scientific rigor in metric design leads to flawed data and ultimately, poor security decisions.
Background
▶ Watch: Problem with corporate security dashboards and bad metrics (0:47)
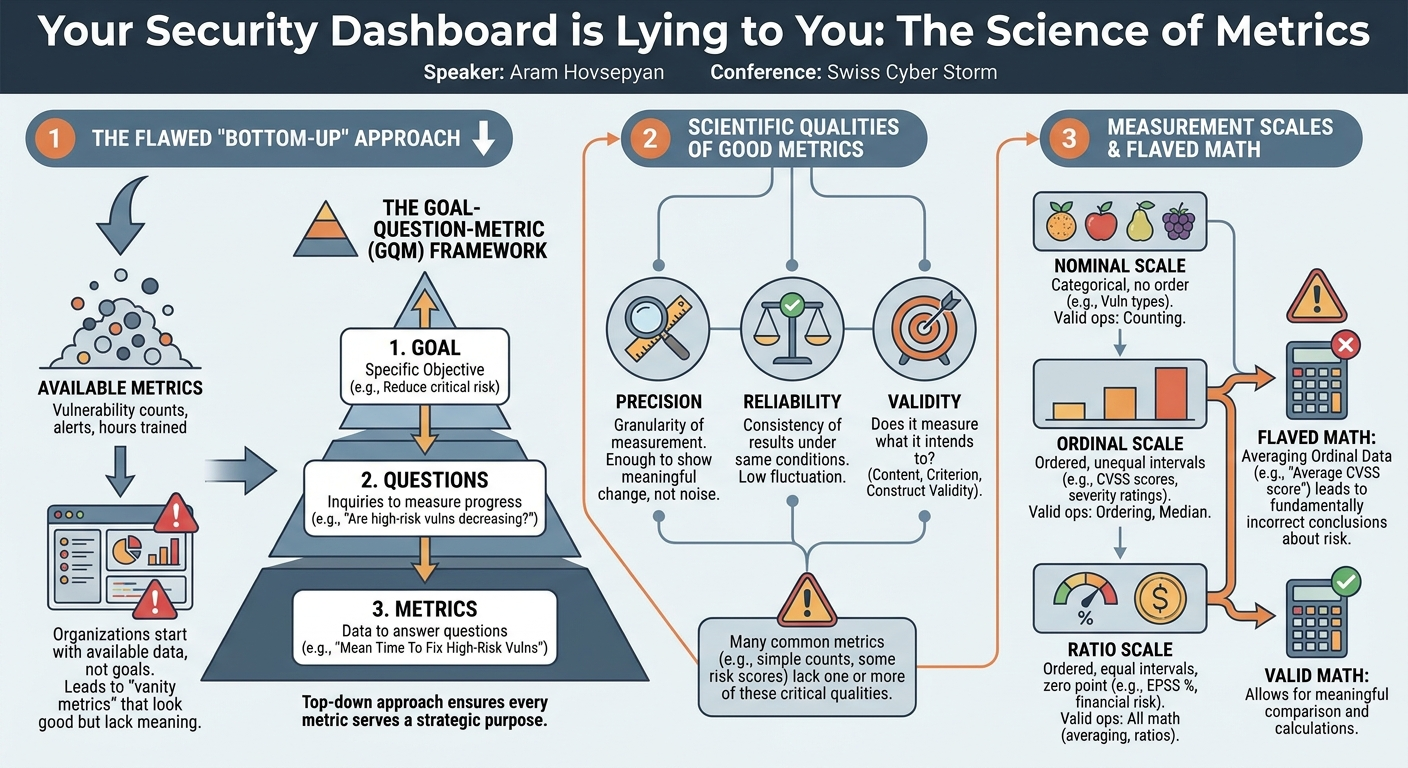
The problem of "lying dashboards" is deeply rooted in how organizations typically approach security measurement. Hovsepyan highlighted a common pitfall: a bottom-up approach where organizations start by looking at available metrics, picking some, and then trying to fit them into a dashboard, rather than first defining clear goals. This often results in dashboards filled with "vanity metrics" – numbers that look good but don't genuinely reflect security posture or progress towards strategic objectives. Examples given include simply tracking "total vulnerabilities" or "number of security alerts," which, without context or proper interpretation, are largely useless.
This issue persists because, as Hovsepyan suggested, there's a widespread lack of understanding of the underlying science of measurement. Many security professionals, while experts in technical domains, may not be equipped with the statistical and scientific tools necessary to design and interpret robust metrics. This leads to an overreliance on quantitative data without considering its quality or appropriateness. The speaker pointed out that this isn't a new problem; the Goal-Question-Metric (GQM) framework, for instance, has existed for over 30 years and was originally developed for managing software defects – a domain Hovsepyan boldly asserts includes vulnerabilities as a subset. The continued prevalence of flawed security metrics, despite the availability of such established methodologies, underscores a critical gap in the industry's approach to security assurance.
Key Findings
▶ Watch: Understanding metric precision and reliability (11:20)
Hovsepyan's talk unveiled several key findings and frameworks essential for moving beyond superficial security metrics:
- The Goal-Question-Metric (GQM) Framework: This framework, though seemingly simple, is crucial. It mandates starting with a specific goal, then defining questions that measure progress towards that goal, and only then selecting metrics to answer those questions. The common mistake is to skip the "questions" layer, jumping directly from metrics to goals, leading to irrelevant data.
- Qualities of Good Metrics: Metrics must possess specific scientific properties to be useful:
- Precision: Refers to the smallest unit of measurement. A metric needs sufficient precision to show meaningful change, but too much precision can also be unhelpful.
- Reliability: The consistency of a measurement. A reliable metric should produce the same result under the same conditions, within an acceptable margin of error.
- Validity: The most critical quality, addressing whether a metric actually measures what it intends to measure. Hovsepyan detailed three types:
- Content Validity: How well the metric covers the scope of the question it's trying to answer.
- Criterion Validity: How well the metric correlates with the actual outcome or behavior of interest.
- Construct Validity: How well the metric correlates with the underlying theoretical concept it aims to represent, which is often harder to directly measure.
- Understanding Measurement Scales: Not all numbers are created equal. Metrics fall into different measurement scales (nominal, ordinal, interval, ratio), each with specific mathematical properties that dictate what operations (e.g., averages, comparisons) are valid. Misapplying mathematical operations based on the wrong scale leads to fundamentally flawed conclusions.
- The "Lying" Nature of Common Metrics: Hovsepyan demonstrated how widely used security metrics, such as simple vulnerability counts, CVSS scores, or certain risk scores (like ASPM 2.0 risk scores), often lack one or more of these critical qualities, rendering them misleading or outright useless for making informed decisions.
Technical Deep Dive
▶ Watch: Understanding measurement scales and avoiding flawed math (23:50)
The core of Hovsepyan's argument against "lying dashboards" lies in a methodical, scientific approach to metric design, drawing on established principles often overlooked in cybersecurity.
The Goal-Question-Metric (GQM) Framework
The Goal-Question-Metric (GQM) framework is presented as the foundational tool for building effective measurement programs. It comprises three distinct layers:
- Goal: This is the specific, measurable objective an organization wants to achieve. For example, "Improve the time to fix high-risk vulnerabilities in production." This must be clearly articulated and focused.
- Questions: These are specific inquiries designed to measure progress towards the defined goal. Hovsepyan emphasized that this layer is often mistakenly skipped. For the goal above, questions might include: "How many high-risk vulnerabilities do we have?" "What is our current mean-time-to-fix (MTTF) for these vulnerabilities?" or "Is the time to fix improving?" These questions bridge the gap between abstract goals and concrete data points.
- Metrics: These are the actual data points collected to answer the questions. For the example questions, relevant metrics could be: "Number of exploitable vulnerabilities in production," "Impact score of each exploitable vulnerability," "Likelihood score of each exploitable vulnerability," and "Time to deploy the fix."
The critical insight here is that starting with metrics (the bottom-up approach) is inherently flawed because there are too many metrics, and they lack context specific to an organization's unique goals. The GQM framework enforces a top-down approach, ensuring every metric collected directly serves a purpose tied to a strategic objective.
Qualities of Effective Metrics
Hovsepyan delved into the intrinsic qualities that define a good metric:
Precision
Precision refers to the smallest unit of measurement. It dictates the granularity with which a metric can capture change.
- Example 1 (Secure Code Training): If measuring developer security awareness, a "pass/fail" metric (Metric 1) has low precision. A "0-10 score" (Metric 2) offers better precision, allowing for more nuanced understanding of performance. A "0-100,000 score" (Metric 3) offers excessive precision, which might not be meaningful or practical. The ideal precision is sufficient to detect meaningful change without being overly granular to the point of noise.
Reliability
Reliability refers to the consistency of a measurement. A reliable metric should yield the same or very similar results when measured repeatedly under the same conditions.
- Example 1 (Weighing Scale): A reliable weighing scale consistently shows the same weight for an object. An unreliable scale, like many body fat percentage scales, gives wildly varying numbers, rendering it useless.
- Example 2 (Vulnerability Likelihood): Hovsepyan compared two metrics for vulnerability exploitation likelihood:
- KEV (Known Exploited Vulnerabilities): A "yes/no" score indicating if a vulnerability has been exploited in the wild. This is highly reliable but coarse-grained (low precision). It changes only when an exploit is confirmed.
- EPSS (Exploit Prediction Scoring System): A machine learning model that predicts the likelihood of exploitation as a percentage (0-1). This offers higher precision but is less reliable, as its prediction can fluctuate daily due to model updates or changing threat landscapes.
Precision vs. Reliability Trade-off
Often, there's a trade-off between precision and reliability. Choosing the right balance depends on the context.
- Example (Secure Coding Test): Imagine five developers with the same security expertise take a test.
- Metric 1 (Pass/Fail): Everyone passes. Highly reliable (consistent outcome for similar expertise) but low precision.
- Metric 2 (0-10 score): Two score 4/10, three score 9/10. High precision, but poor reliability (inconsistent scores for similar expertise), suggesting the test itself might be flawed or inconsistent.
- Metric 3 (0-100 score): Everyone scores 30/100. Good precision and good reliability (consistent scores). However, if these developers are known experts, this metric has poor validity because it doesn't reflect their actual high expertise. This leads to the next crucial concept.
Validity of Metrics
Validity is arguably the most important quality: does the metric actually measure what it's supposed to measure? Hovsepyan outlined three types:
- Content Validity: How much of the intended outcome or question does the metric cover?
- Example (Security Awareness): Measuring "hours of training covered" (Metric 1) has low content validity because it doesn't indicate learning. "Number of top security risks seen throughout the training" (Metric 2) has better content validity as it directly relates to the training's content.
- Criterion Validity: How well does the metric correlate with a known, external outcome or criterion?
- Example (Security Awareness Retention):
- Metric 1: Percentage of top security risks seen in training (good content validity).
- Metric 2: Score immediately after training (better criterion validity, as it correlates with immediate understanding).
- Metric 3: Score a year after training (best criterion validity, as it correlates with long-term retention, which is often the true goal).
- Example (Expert Developers): If expert developers consistently score 30/100 on a test (Metric 3 from above), the test has poor criterion validity because it doesn't correlate with their known high expertise. A "pass" metric (Metric 1) might have better criterion validity in this specific scenario, even with lower precision, if all experts are expected to pass.
- Construct Validity: How well does the metric correlate with the underlying theoretical construct or concept it aims to measure, especially when that concept is not directly observable? This is the hardest to achieve.
- Example (Cyber Attack Preparedness):
- Metric 1: Security awareness scores a year after training (good criterion validity for retention).
- Metric 2: Results from attack simulation exercises (ideally with novel content). This has better construct validity because it attempts to measure the abstract concept of "preparedness for a real attack" through a realistic proxy.
- Metric 3: Performance during an actual cyber attack (perfect construct validity, but too late to be proactive).
- Analogy (IQ Tests): Early IQ tests given to immigrants had poor construct validity. They measured knowledge gained in specific schooling systems, not inherent intelligence, leading to flawed conclusions about intelligence levels.
Measurement Scales and Flawed Math
Hovsepyan concluded the technical deep dive by emphasizing the critical importance of measurement scales, which dictate valid mathematical operations. He simplified them into three main types:
- Nominal Scale: Categorical data with no inherent order.
- Examples: Vulnerability types like SQL injection, Cross-Site Scripting (XSS), CSRF.
- Valid Operations: Only counting frequencies (mode). You cannot say SQLi is "worse" or "better" than XSS in a mathematical sense without a defined, quantifiable scale.
- Flawed Math: Stating "SQL injection is worse than XSS" as a general rule without context.
- Ordinal Scale: Categorical data with a clear order, but without equal intervals between categories.
- Examples: Severity ratings like "low," "medium," "high." CVSS scores (e.g., a score of 5 vs. 10) fall into this category because they are derived from a vector of ordinal labels.
- Valid Operations: Ordering, median. You cannot calculate averages or assert that "a CVSS score of 10 is twice as severe as a CVSS score of 5" because the intervals between scores are not uniform or quantifiable in that way.
- Flawed Math: Claiming "one high vulnerability is worse than ten medium vulnerabilities" or "CVSS 10 is twice CVSS 5." This assumes an interval or ratio scale, which CVSS is not.
- Ratio Scale: Data with a clear order, equal intervals, and a meaningful absolute zero point.
- Examples: EPSS scores (0-1, representing a percentage likelihood), risk value in dollars.
- Valid Operations: All mathematical operations (addition, subtraction, multiplication, division, averages, ratios). You can say an EPSS score of 1.0 is twice as likely as an EPSS score of 0.5.
Hovsepyan explicitly stated that ASPM (Application Security Posture Management) risk scores often fall victim to flawed mathematics because they aggregate metrics from different scales without respecting their underlying mathematical properties. This leads to aggregate scores that are meaningless or misleading, despite appearing quantitative.
Demo / Proof of Concept
▶ Watch: Summary: Valid, precise, reliable metrics (27:00)
Aram Hovsepyan's talk did not include a live demonstration or a traditional proof of concept. Instead, the presentation itself served as a "proof of concept" for a scientific approach to security metrics. He provided the audience with intellectual tools and frameworks—the GQM framework, the concepts of precision, reliability, and validity, and the understanding of measurement scales—to critically analyze and improve their own security dashboards. The "demonstration" was in the form of interactive questions posed to the audience, challenging their intuitive understanding of what constitutes a "good" metric and then systematically explaining the scientific rationale behind the correct (or more appropriate) choice. He referred to his online resources (appsacience.com) for deeper dives into specific topics, such as the flawed math behind ASPM risk scores.
Defensive Implications
▶ Watch: The overlooked value of qualitative metrics (29:20)
The insights from Hovsepyan’s talk offer profound defensive implications for organizations seeking to genuinely improve their security posture rather than merely generating reassuring but inaccurate reports.
- Adopt the GQM Framework: Defenders should proactively implement the Goal-Question-Metric (GQM) framework at the outset of any security measurement initiative. This means starting with specific, well-defined security goals (e.g., "Reduce the risk of critical data exfiltration"), then formulating clear questions that measure progress towards these goals (e.g., "What is the average time to detect a critical data exfiltration attempt?"), and only then identifying the appropriate metrics (e.g., "Mean Time To Detect (MTTD) for critical incidents"). This top-down approach ensures metrics are always relevant and actionable.
- Critically Evaluate Existing Metrics: Organizations must scrutinize their current dashboards and metrics for precision, reliability, and validity.
- Precision: Are metrics granular enough to show meaningful change, but not so granular as to introduce noise? For example, moving beyond a simple "pass/fail" for security training to a more nuanced score, if the precision is justified.
- Reliability: Do metrics consistently reflect the underlying reality? If a metric fluctuates wildly without a corresponding change in the security environment (e.g., EPSS scores changing daily for no apparent reason), its reliability should be questioned. Prioritize highly reliable metrics where possible.
- Validity: This is paramount. Does "number of lines of code" truly predict security quality (low validity)? Does "hours of security training" truly measure security awareness (low content validity)? Defenders should seek metrics with high content, criterion, and construct validity that directly measure what they aim to understand about their security posture.
- Understand Measurement Scales: Crucially, security teams must educate themselves on nominal, ordinal, and ratio scales to avoid misinterpreting data. Do not average CVSS scores, as they are ordinal. Do not treat vulnerability types as inherently "worse" or "better" without a quantifiable, ratio-scale measure of impact. Applying incorrect mathematical operations to metrics can lead to false conclusions about risk and resource allocation.
- Prioritize Meaningful Over Convenient: Resist the temptation to use readily available or "easy" metrics if they don't align with clearly defined goals and possess the necessary scientific qualities. Focus on answering meaningful questions, even if it requires more effort to define or collect the right data.
- Consider Qualitative Metrics: Hovsepyan suggested that not all metrics need to be quantitative. Qualitative metrics, such as self-reported security posture or perceived intensity of a security incident response, can sometimes be more insightful and reliable than flawed quantitative ones. This opens avenues for collecting data through surveys, interviews, or structured feedback, especially for areas like security culture or team effectiveness.
- Challenge Industry Standards: Be critical of widely adopted but scientifically flawed metrics, such as certain aggregated risk scores (e.g., ASPM 2.0). Understand their limitations and advocate for more robust, scientifically sound alternatives.
By adopting these principles, defenders can transform their security dashboards from sources of misleading information into powerful tools that accurately reflect their security state, enable informed decision-making, and genuinely drive improvements.
Key Takeaways
- Start with Goals, Not Metrics: Always begin with a specific, well-defined security goal, then define questions that measure progress, and only then select metrics (the Goal-Question-Metric framework). Avoid the bottom-up approach of picking metrics first.
- Metrics Must Be Valid, Precise, and Reliable: Good metrics are not just numbers; they possess scientific qualities. Validity (measuring what you intend to measure) is paramount, followed by adequate precision (granularity) and reliability (consistency).
- Understand Measurement Scales: Different types of metrics (nominal, ordinal, ratio) have different mathematical properties. Applying incorrect mathematical operations (e.g., averaging CVSS scores or comparing nominal categories directly) leads to fundamentally flawed conclusions.
- Challenge "Lying" Dashboards: Many common security dashboards present misleading data due to a lack of scientific rigor. Be critical of existing metrics, even widely accepted ones, if they lack validity, precision, or reliability.
- Focus on Meaningful Questions: Prioritize metrics that answer meaningful security questions and drive actionable insights, rather than convenient metrics that merely fill a dashboard with "nice numbers in nice colors."
- Consider Qualitative Data: Not all effective metrics are quantitative. Qualitative assessments, such as self-reported feelings or perceived effectiveness, can sometimes offer more reliable insights than poorly designed quantitative metrics.
About the Speaker(s)
Aram Hovsepyan is the CEO of Codif, a company based in Belgium. He holds a PhD from the University of Leiden, where he specialized in metrics and Key Performance Indicators (KPIs) for measuring security. With approximately 15 years of experience in the Application Security (AbSec) domain, Hovsepyan has worn multiple hats throughout his career: initially as a researcher at the University of Leven, then transitioning to an industry expert leading a product company (Codif). More recently, he has been actively involved with the OWASP Software Assurance Maturity Model (SAM) project for three to four years, contributing to its mission of helping organizations measure and improve their application security processes, methodologies, and tooling. In his free time, he is also a semi-professional kite surfer.
Reviews
Dr. Zero (Offensive Security Researcher) — SOLID
Hovsepyan is absolutely right that your security dashboard is lying to you, though his fix is just a 30-year-old software engineering framework. It's a highly competent takedown of vendor metric math that CISOs desperately need to hear, even if the underlying science isn't new.
Heather Calloway (CISO) — STRONG ACCEPT
A rigorous teardown of why most security dashboards are statistically invalid. If you are using aggregated ASPM scores or averaging CVSS to justify headcount or budget, you need to understand why the underlying math is broken before your audit committee figures it out.